 2
2peptides
spectra
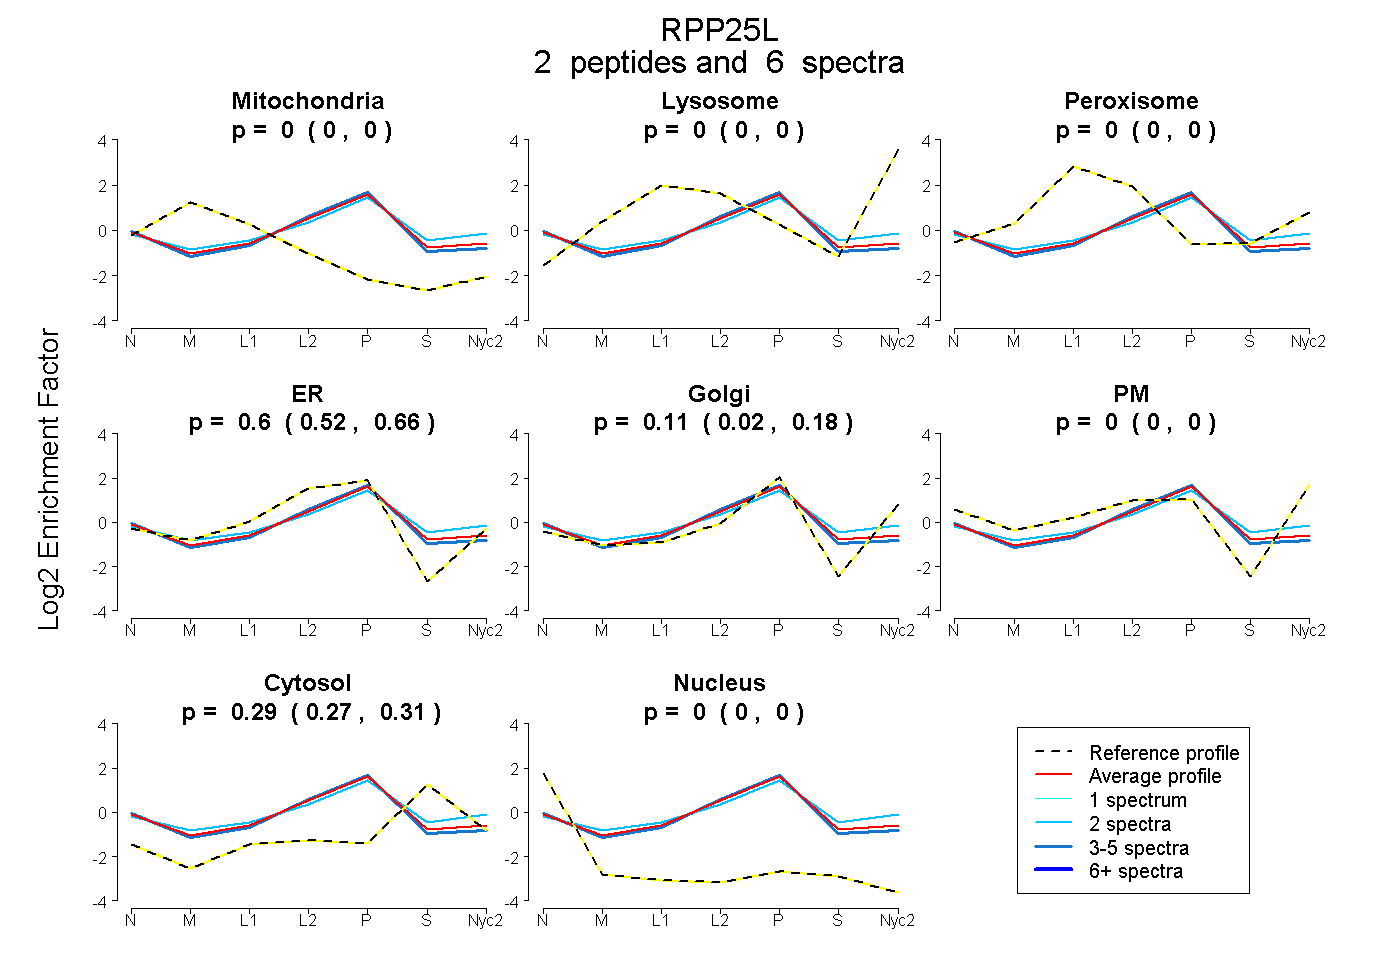
0.000 | 0.000
0.000 | 0.000
0.000 | 0.001
0.521 | 0.662
0.022 | 0.183
0.000 | 0.000
0.266 | 0.307
0.000 | 0.000
1peptide
spectra
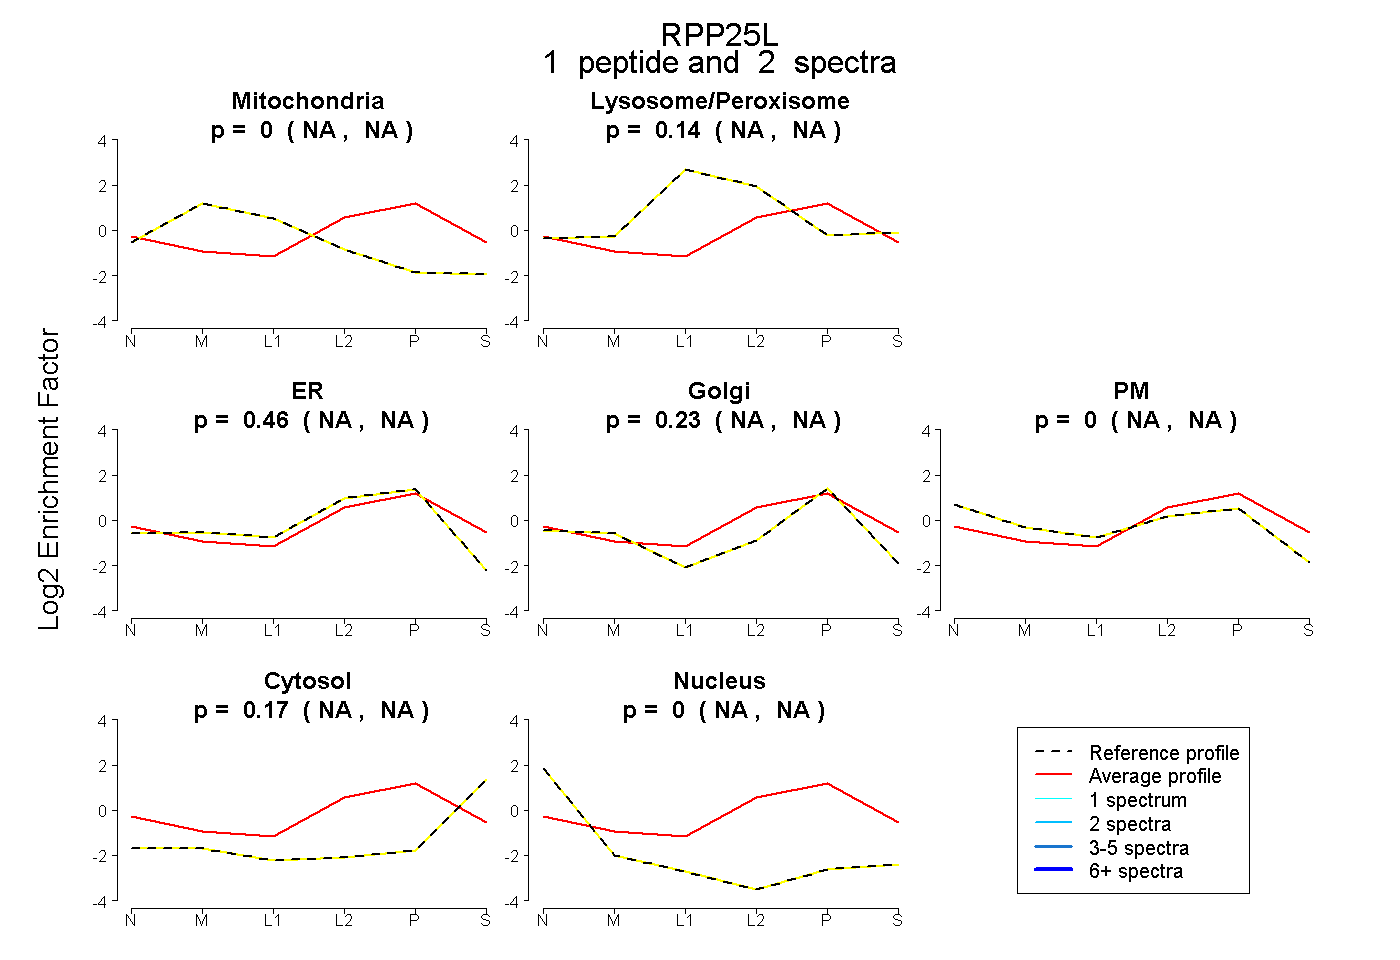
NA | NA
NA | NA
NA | NA
NA | NA
NA | NA
NA | NA
NA | NA
2peptides
spectra
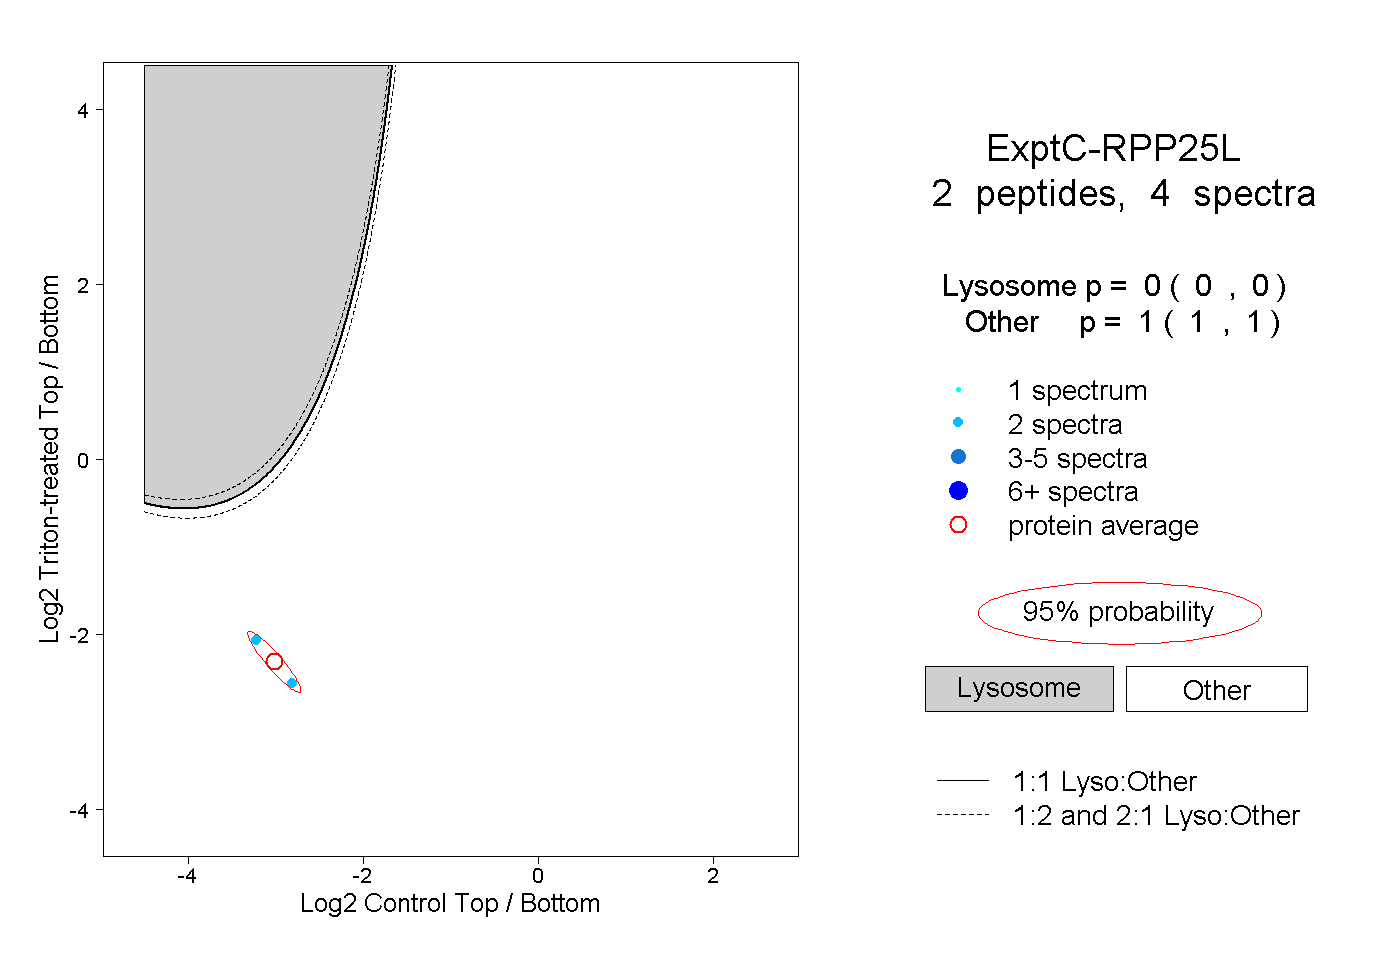
0.000 | 0.000
1.000 | 1.000