 2
2peptides
spectra
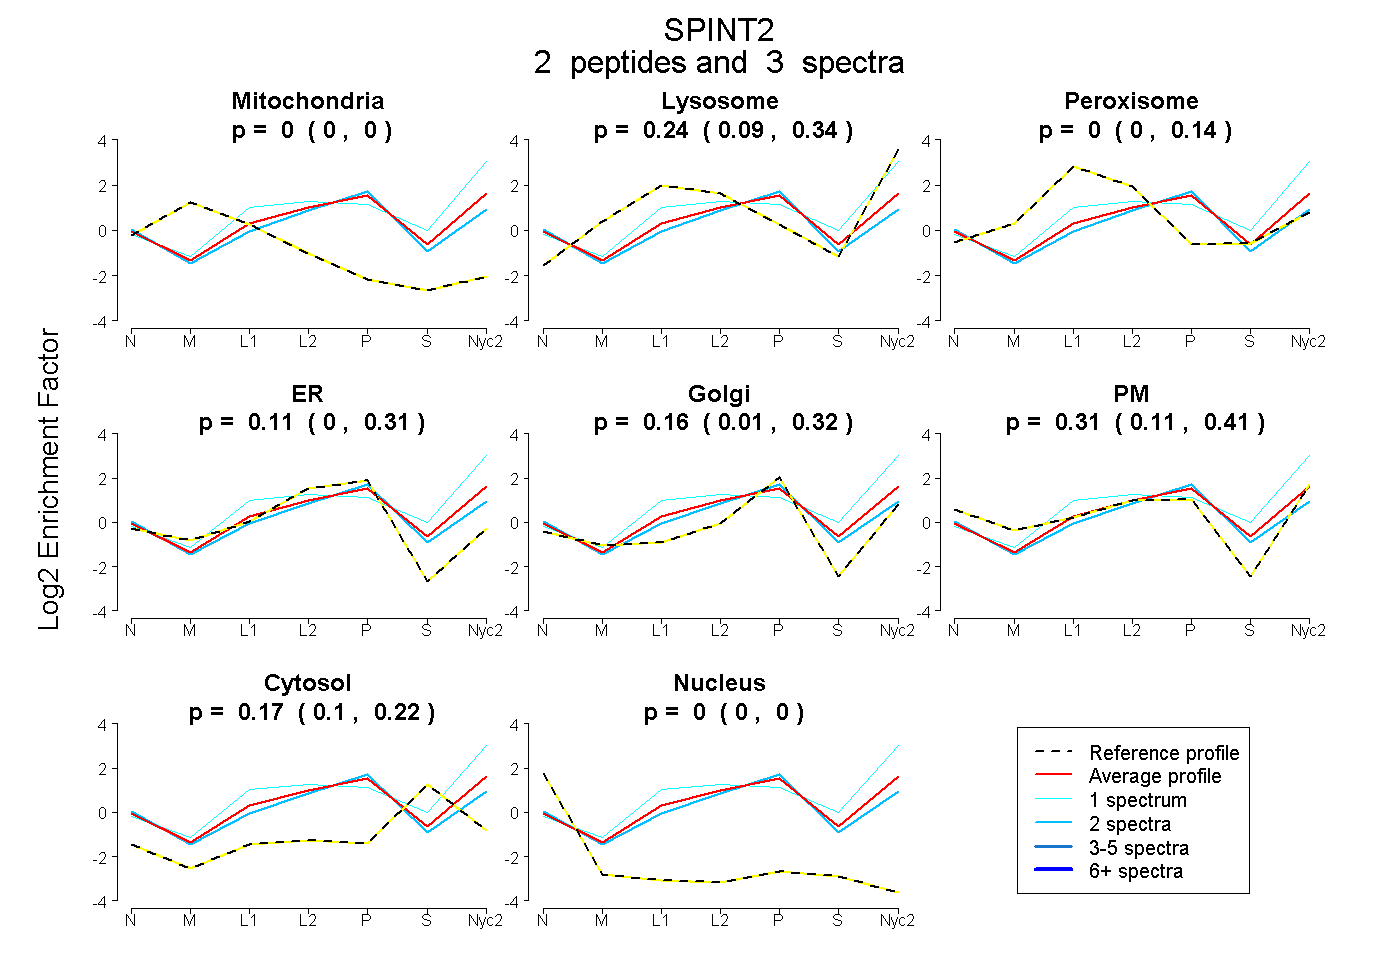
0.000 | 0.000
0.087 | 0.335
0.000 | 0.145
0.000 | 0.309
0.005 | 0.316
0.110 | 0.413
0.095 | 0.224
0.000 | 0.000
| Plot | Mito | Lyso | Perox | ER | Golgi | PM | Cytosol | Nucleus | |||||
| Expt A |
2 peptides |
3 spectra |
|
0.000 0.000 | 0.000 |
0.241 0.087 | 0.335 |
0.000 0.000 | 0.145 |
0.112 0.000 | 0.309 |
0.164 0.005 | 0.316 |
0.313 0.110 | 0.413 |
0.170 0.095 | 0.224 |
0.000 0.000 | 0.000 |
| 1 spectrum, AVTGPCR | 0.000 | 0.567 | 0.000 | 0.000 | 0.000 | 0.278 | 0.155 | 0.000 | ||
| 2 spectra, DLDVHENTIDGLAR | 0.000 | 0.092 | 0.000 | 0.271 | 0.217 | 0.246 | 0.174 | 0.000 |
| Plot | Lyso | Other | |||||||||||
| Expt C |
4 peptides |
8 spectra |
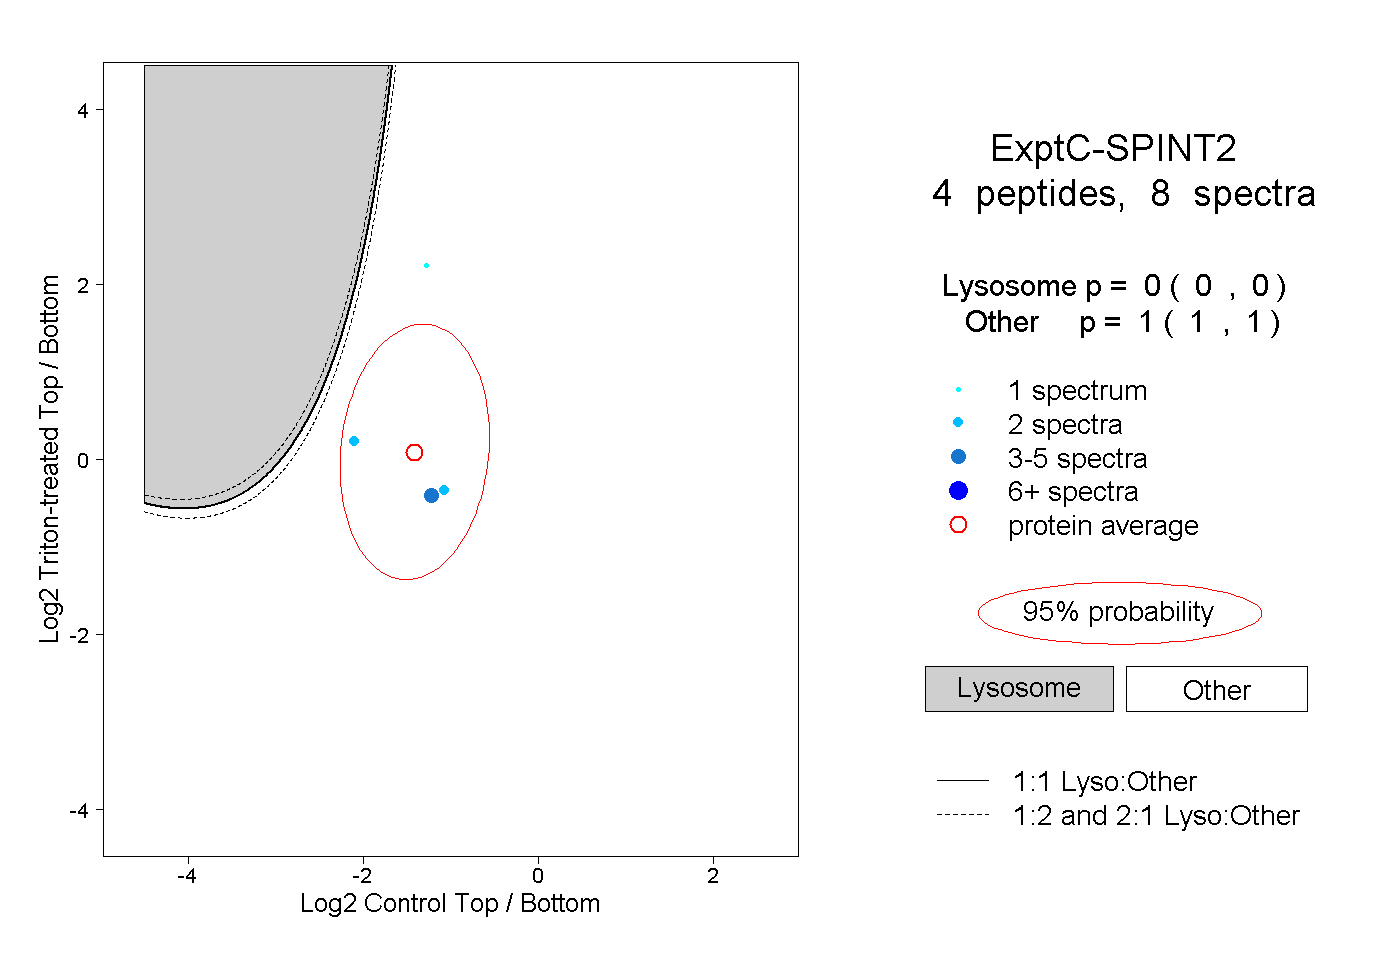 |
0.000 0.000 | 0.000 |
1.000 1.000 | 1.000 |