 13
13peptides
spectra
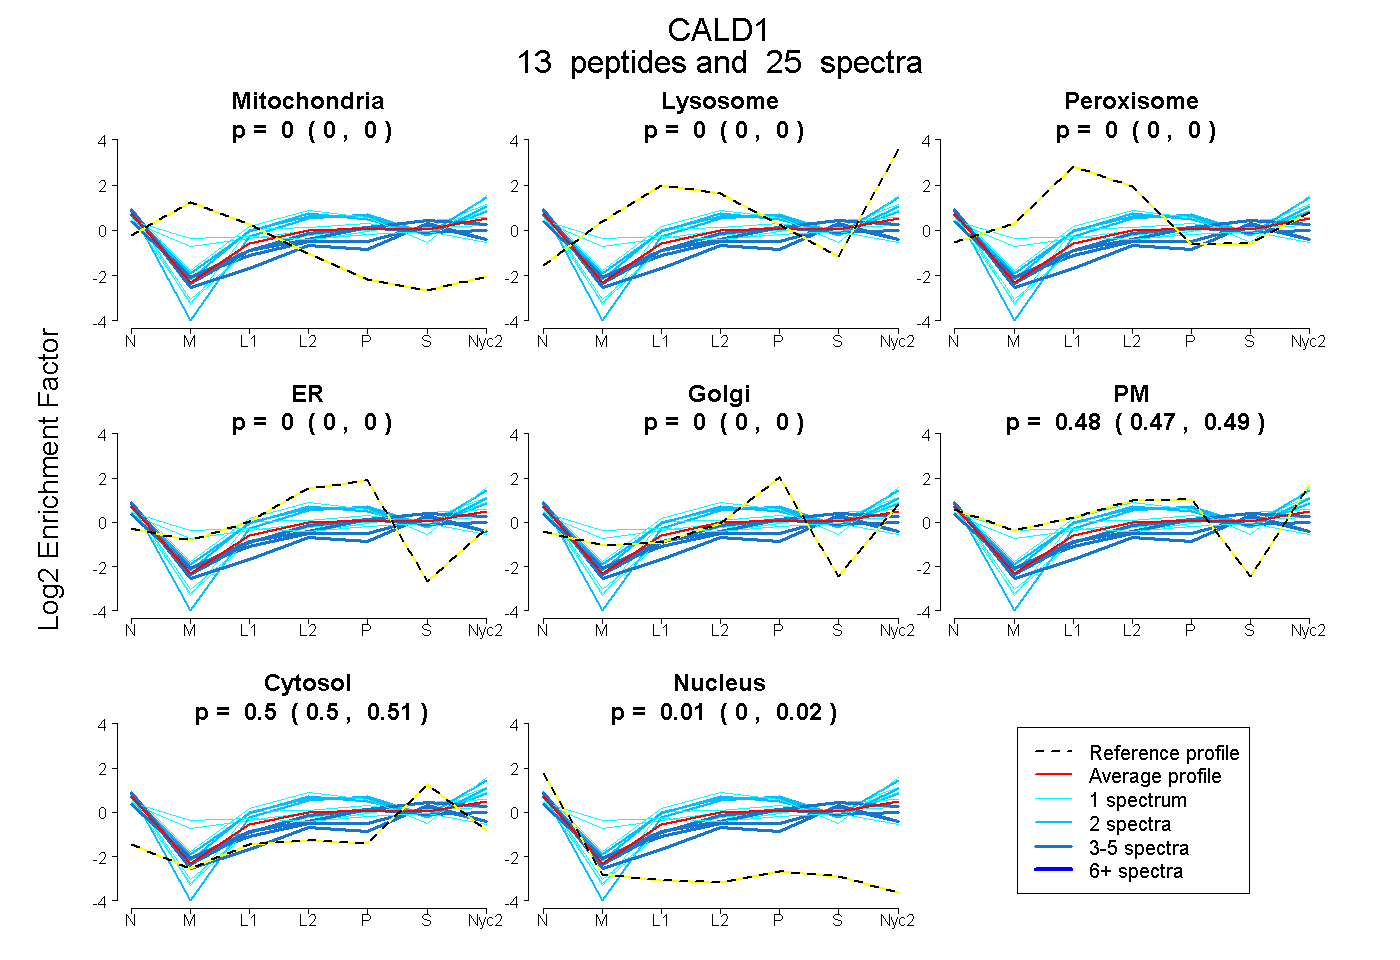
0.000 | 0.000
0.000 | 0.000
0.000 | 0.000
0.000 | 0.000
0.000 | 0.000
0.475 | 0.492
0.498 | 0.511
0.003 | 0.017
| Plot | Mito | Lyso | Perox | ER | Golgi | PM | Cytosol | Nucleus | |||||
| Expt A |
13 peptides |
25 spectra |
|
0.000 0.000 | 0.000 |
0.000 0.000 | 0.000 |
0.000 0.000 | 0.000 |
0.000 0.000 | 0.000 |
0.000 0.000 | 0.000 |
0.485 0.475 | 0.492 |
0.505 0.498 | 0.511 |
0.011 0.003 | 0.017 |
| 1 spectrum, YEMEETEVVITSYQK | 0.160 | 0.000 | 0.122 | 0.000 | 0.000 | 0.300 | 0.380 | 0.038 | ||
| 1 spectrum, SPDGNK | 0.000 | 0.001 | 0.071 | 0.000 | 0.000 | 0.676 | 0.253 | 0.000 | ||
| 1 spectrum, EAEGAPQVEAGK | 0.000 | 0.000 | 0.000 | 0.000 | 0.000 | 0.362 | 0.627 | 0.012 | ||
| 3 spectra, EFDPTITDGSLSVPSR | 0.000 | 0.000 | 0.000 | 0.000 | 0.000 | 0.334 | 0.541 | 0.124 | ||
| 1 spectrum, GSVFSSPSASGTPNK | 0.000 | 0.000 | 0.000 | 0.000 | 0.000 | 0.522 | 0.478 | 0.000 | ||
| 1 spectrum, GETESEEFEK | 0.000 | 0.000 | 0.000 | 0.000 | 0.000 | 0.396 | 0.537 | 0.067 | ||
| 4 spectra, VLEEEEQR | 0.000 | 0.000 | 0.000 | 0.000 | 0.000 | 0.446 | 0.465 | 0.089 | ||
| 2 spectra, LEQYTNAIEGTK | 0.000 | 0.000 | 0.019 | 0.000 | 0.000 | 0.619 | 0.362 | 0.000 | ||
| 3 spectra, MPEDGLSEDK | 0.000 | 0.000 | 0.000 | 0.000 | 0.000 | 0.402 | 0.598 | 0.000 | ||
| 3 spectra, NSYQDAEDK | 0.000 | 0.000 | 0.000 | 0.000 | 0.000 | 0.255 | 0.568 | 0.177 | ||
| 2 spectra, INEWLTK | 0.000 | 0.032 | 0.027 | 0.000 | 0.000 | 0.607 | 0.335 | 0.000 | ||
| 1 spectrum, AEFLNK | 0.000 | 0.081 | 0.041 | 0.000 | 0.000 | 0.464 | 0.414 | 0.000 | ||
| 2 spectra, ASKPMKPAASDLPVPAEGVR | 0.000 | 0.000 | 0.000 | 0.044 | 0.000 | 0.477 | 0.478 | 0.000 |
| Plot | Mito | Lyso or Perox | ER | Golgi | PM | Cytosol | Nucleus | ||||||
| Expt B |
2 peptides |
2 spectra |
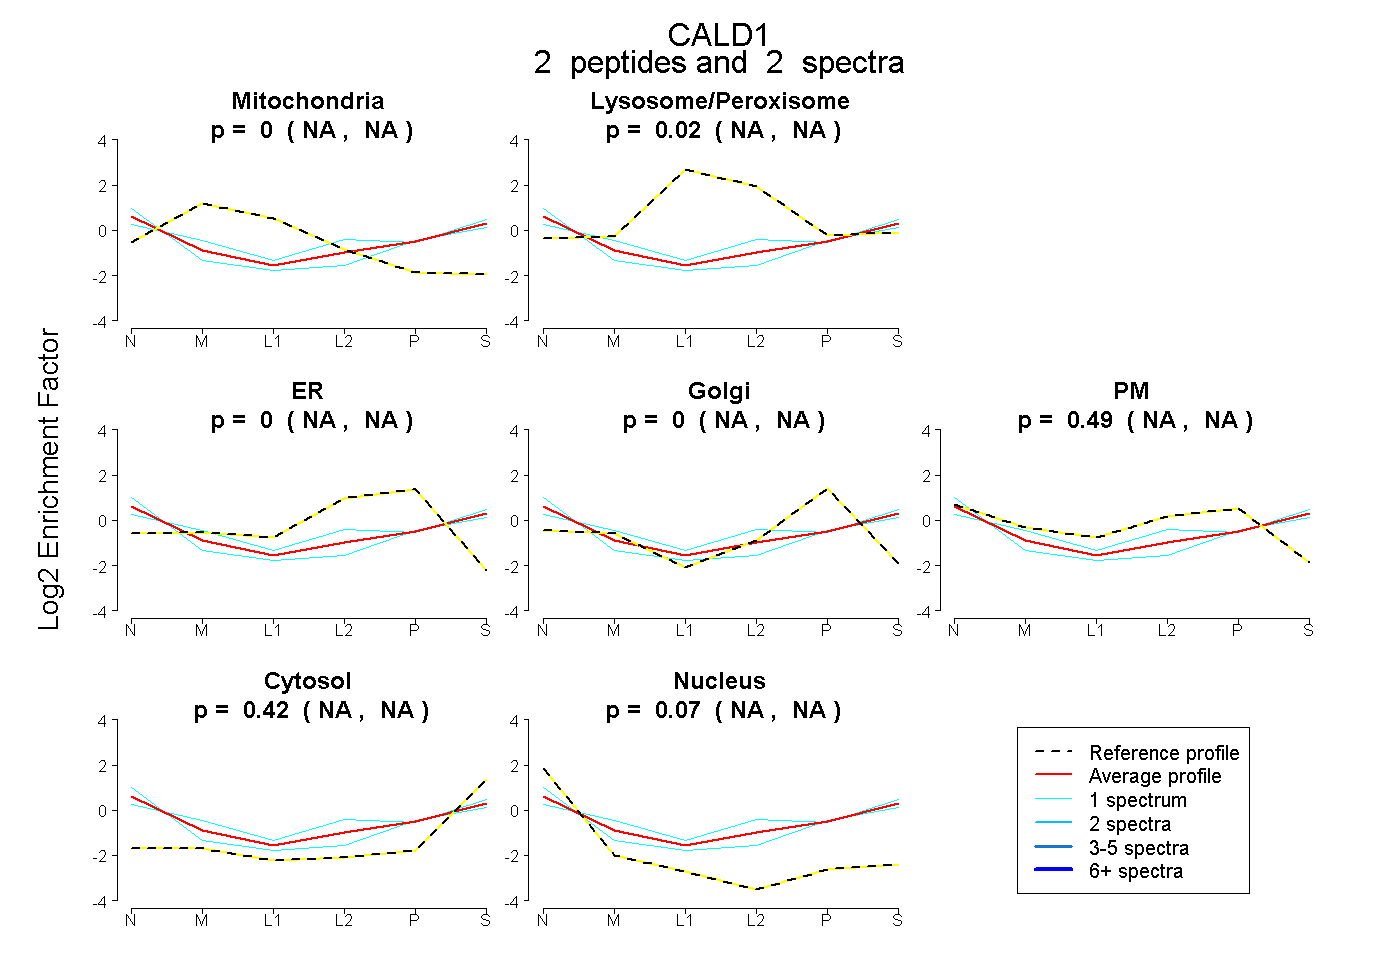 |
0.000 NA | NA |
0.023 NA | NA |
0.000 NA | NA |
0.000 NA | NA |
0.486 NA | NA |
0.425 NA | NA |
0.067 NA | NA |
|||
| Plot | Lyso | Other | |||||||||||
| Expt C |
16 peptides |
63 spectra |
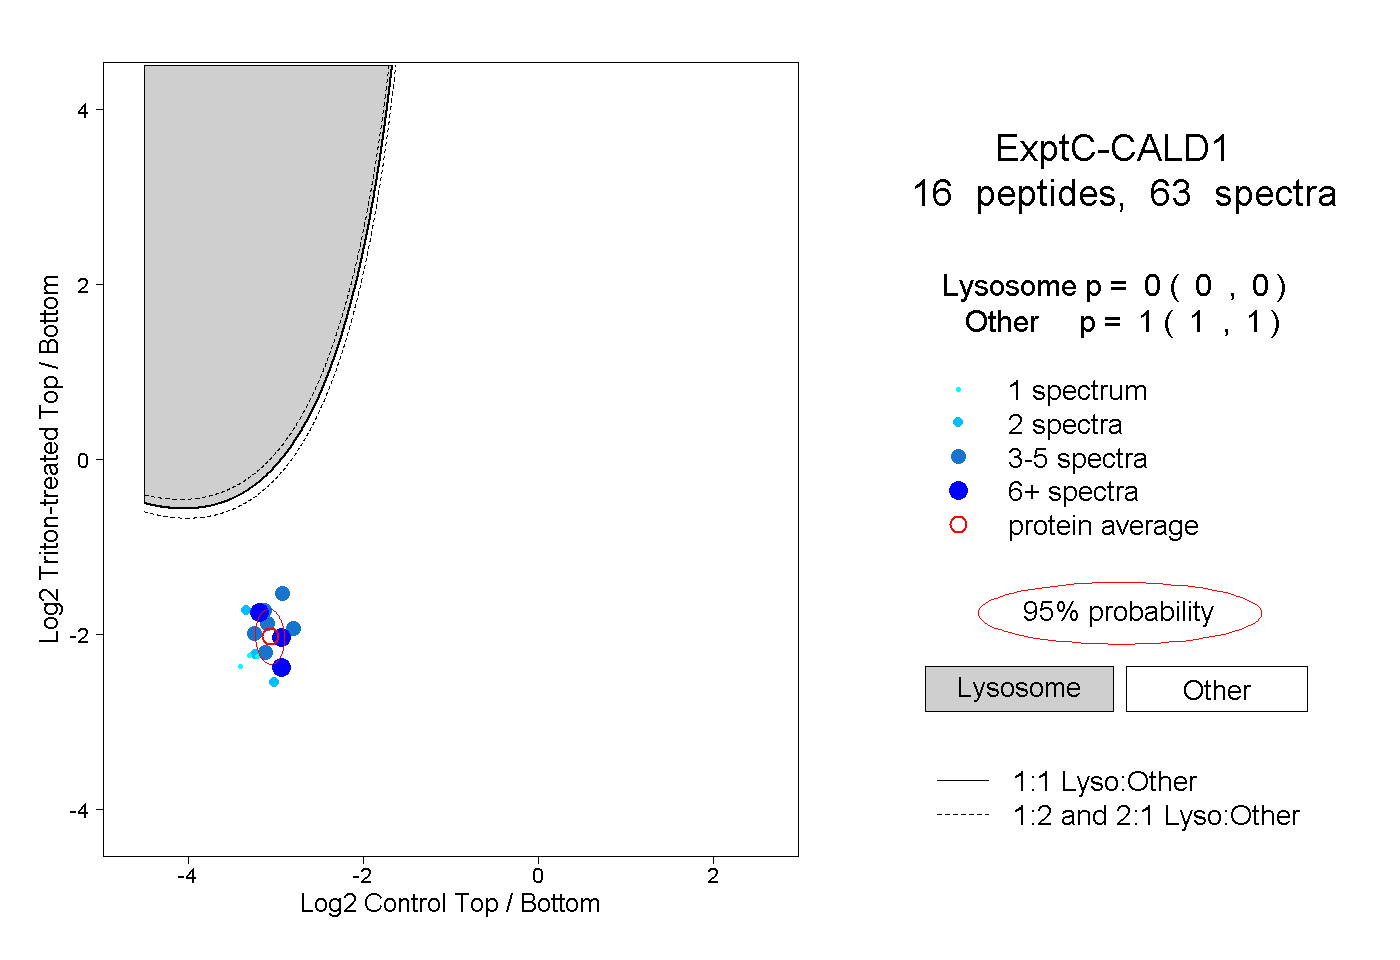 |
0.000 0.000 | 0.000 |
1.000 1.000 | 1.000 |
||||||||
| Plot | Lyso | Other | |||||||||||
| Expt D |
1 peptide |
7 spectra |
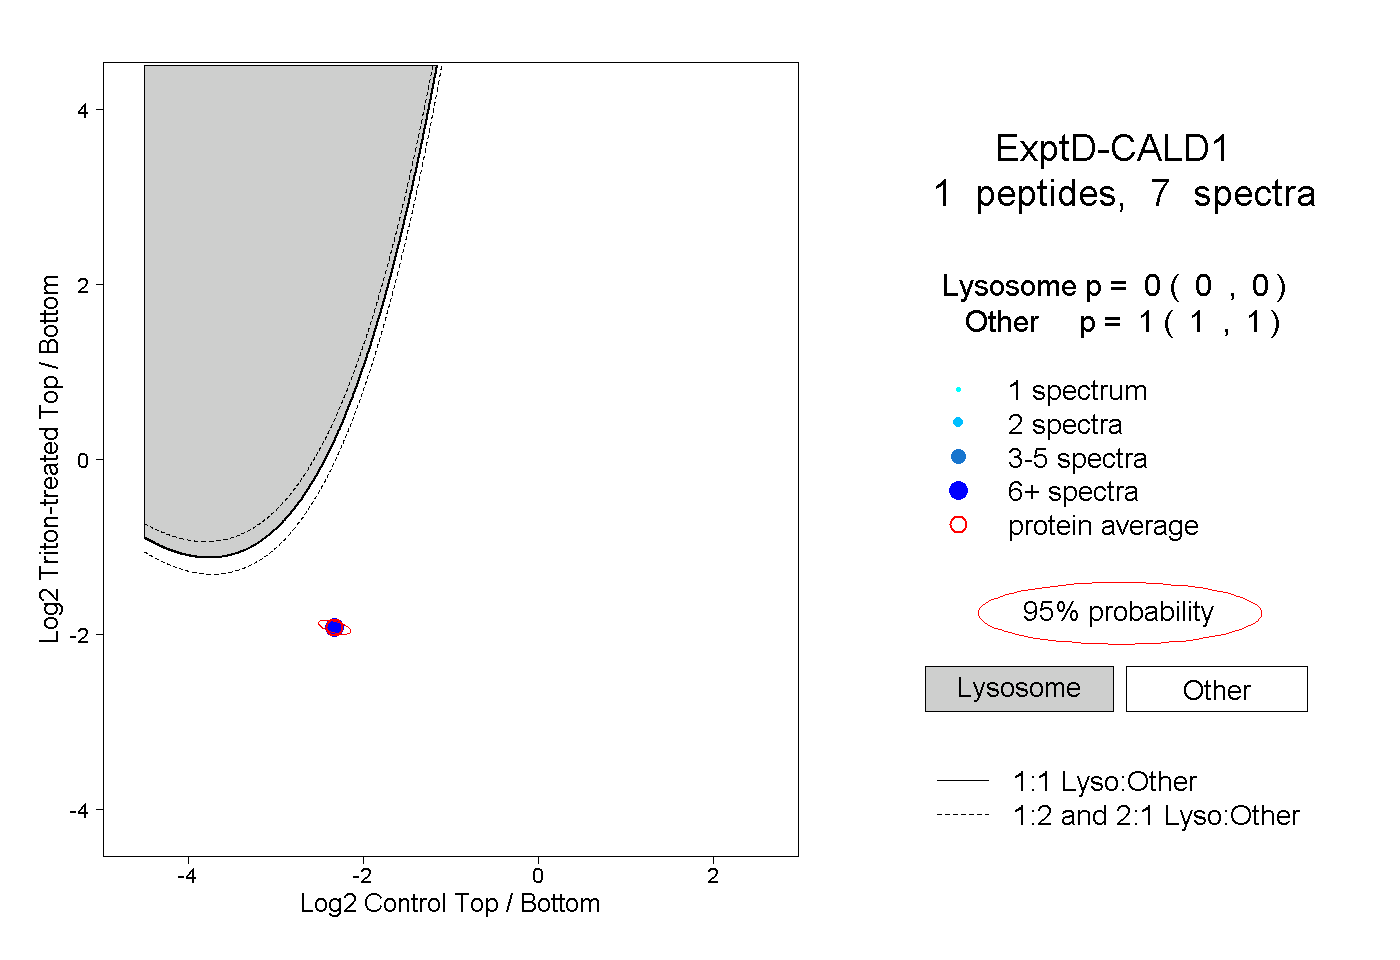 |
0.000 0.000 | 0.000 |
1.000 1.000 | 1.000 |