 2
2peptides
spectra
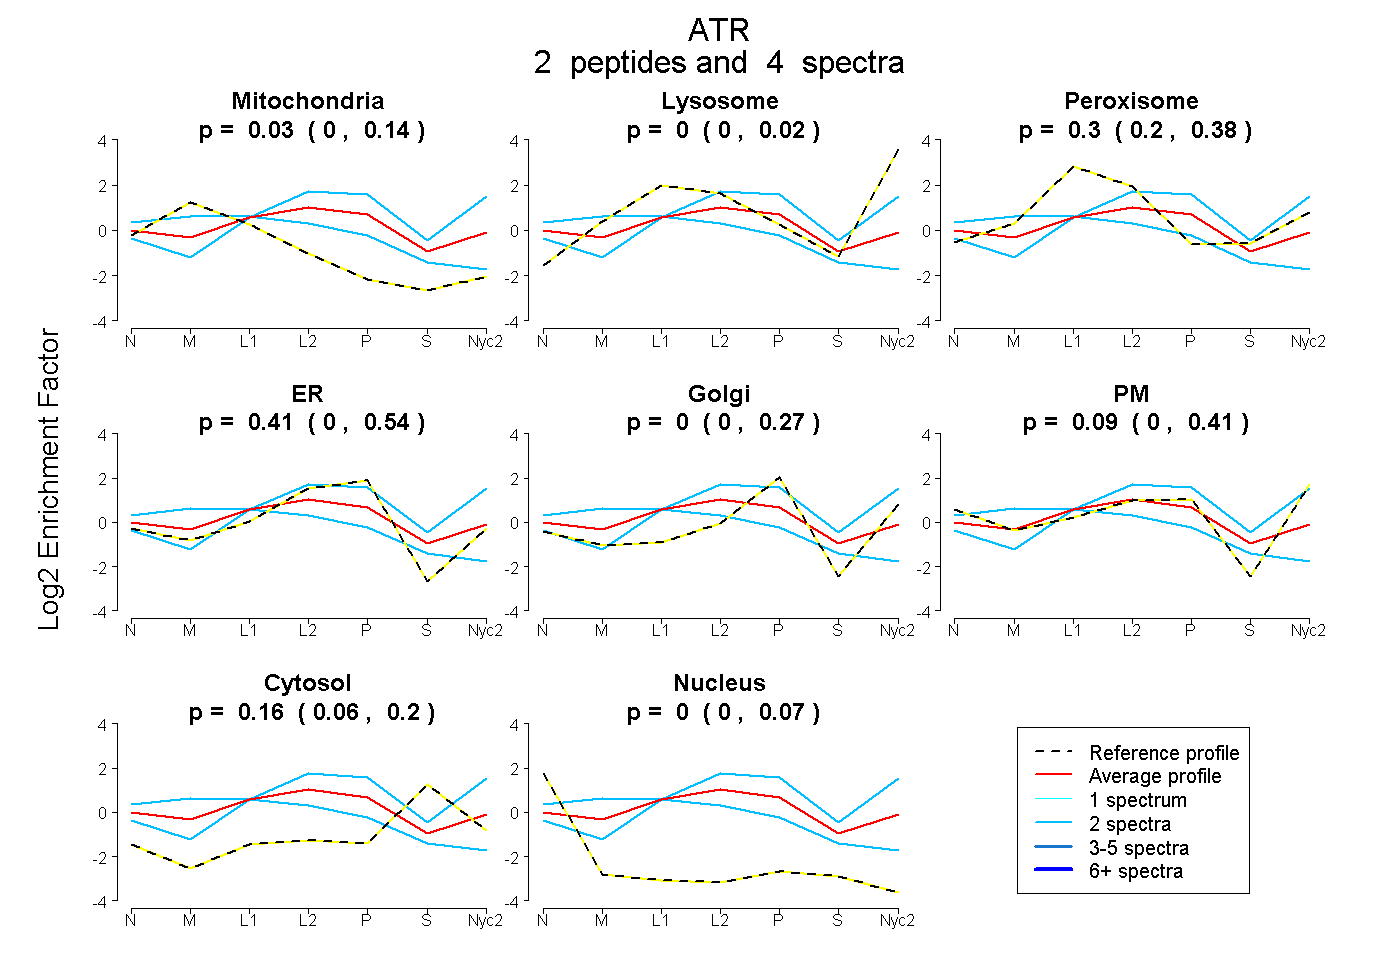
0.000 | 0.143
0.000 | 0.023
0.203 | 0.379
0.000 | 0.541
0.000 | 0.269
0.000 | 0.411
0.061 | 0.197
0.000 | 0.067
| Plot | Mito | Lyso | Perox | ER | Golgi | PM | Cytosol | Nucleus | |||||
| Expt A |
2 peptides |
4 spectra |
|
0.033 0.000 | 0.143 |
0.000 0.000 | 0.023 |
0.300 0.203 | 0.379 |
0.410 0.000 | 0.541 |
0.000 0.000 | 0.269 |
0.094 0.000 | 0.411 |
0.162 0.061 | 0.197 |
0.000 0.000 | 0.067 |
| 2 spectra, FPEHVR | 0.445 | 0.000 | 0.204 | 0.286 | 0.000 | 0.000 | 0.024 | 0.041 | ||
| 2 spectra, HMLIHGR | 0.000 | 0.383 | 0.000 | 0.432 | 0.000 | 0.040 | 0.145 | 0.000 |
| Plot | Lyso | Other | |||||||||||
| Expt D |
1 peptide |
2 spectra |
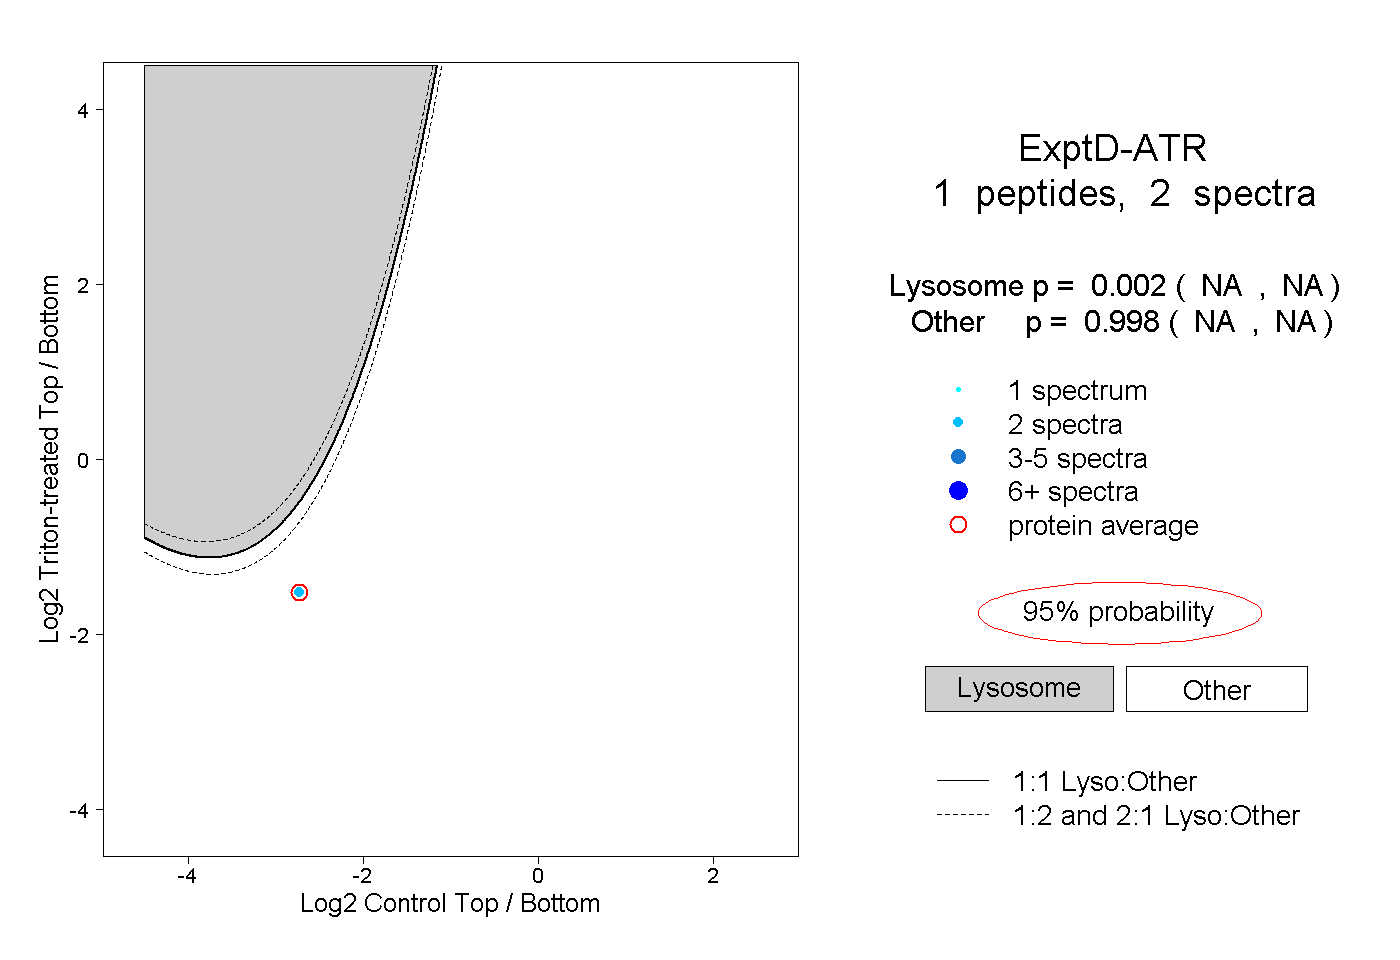 |
0.002 NA | NA |
0.998 NA | NA |