 26
26peptides
spectra
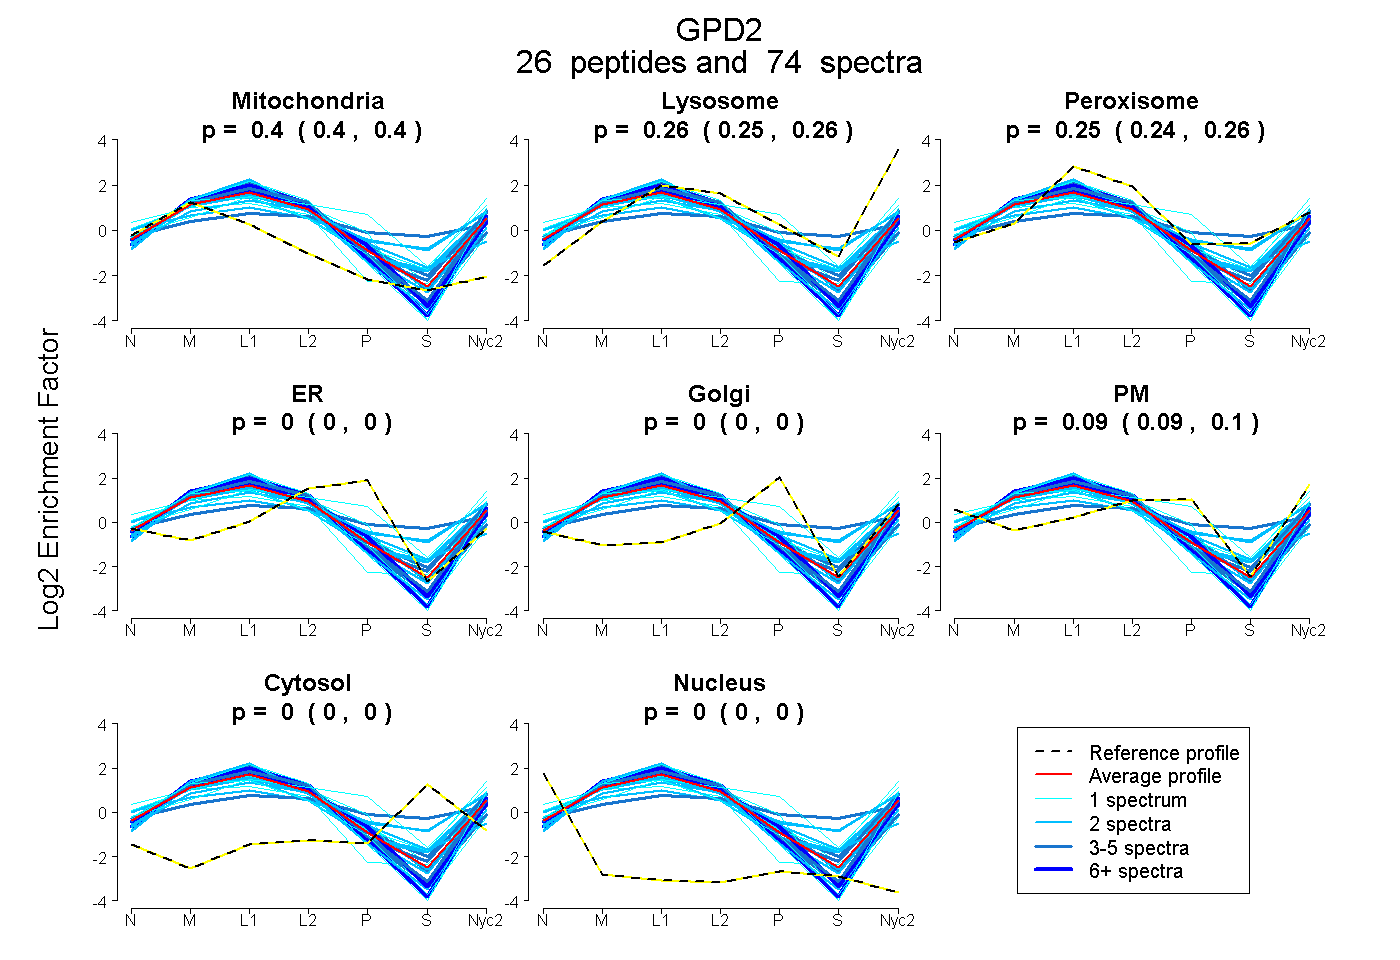
0.395 | 0.403
0.251 | 0.262
0.239 | 0.257
0.000 | 0.000
0.000 | 0.000
0.088 | 0.100
0.000 | 0.000
0.000 | 0.000
6peptides
spectra
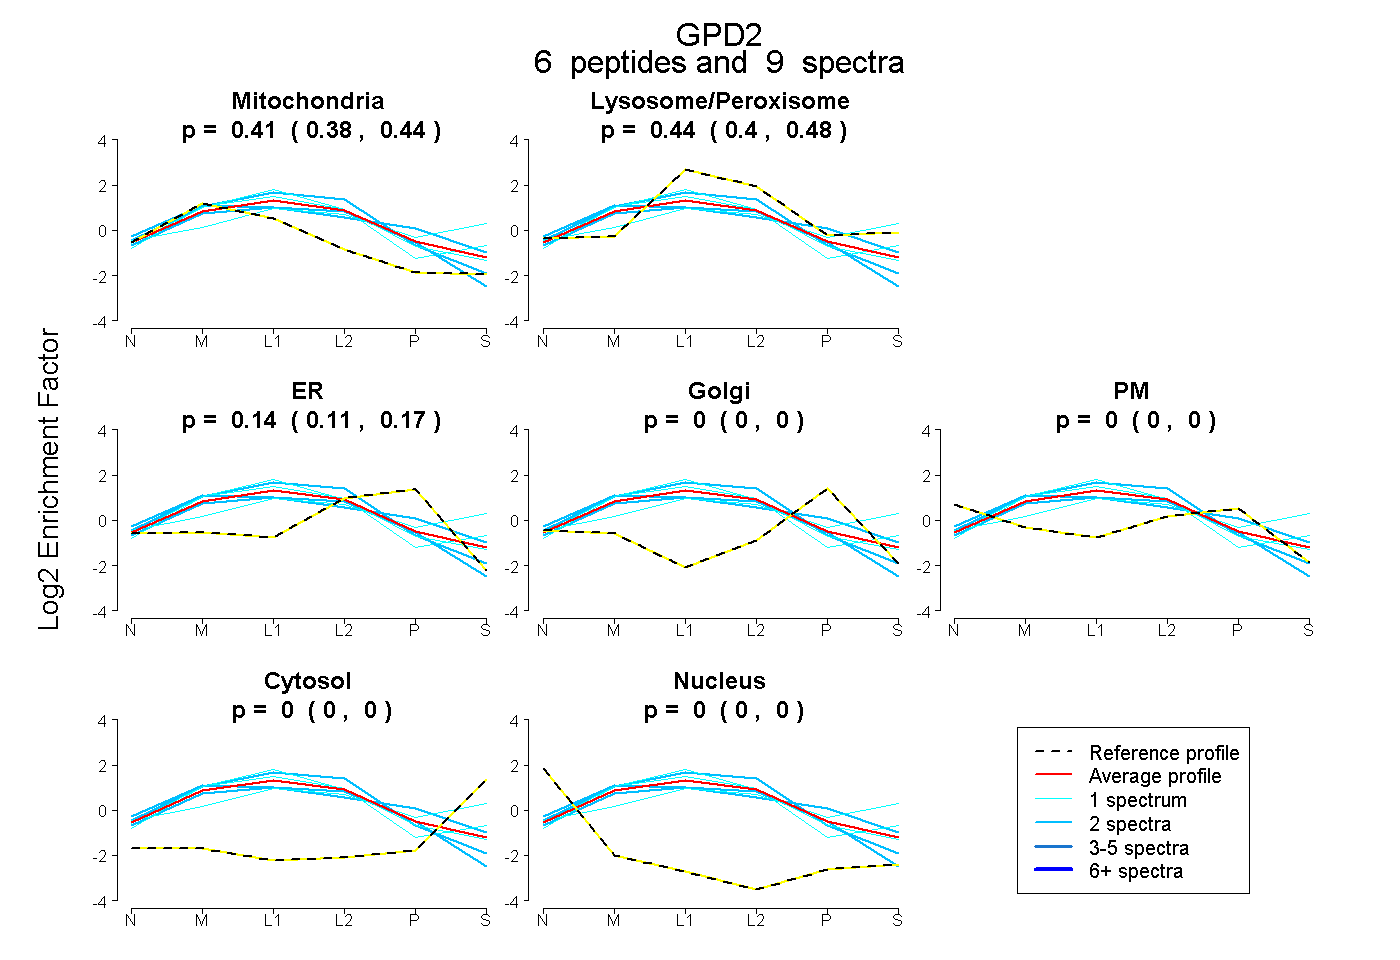
0.382 | 0.438
0.403 | 0.476
0.111 | 0.174
0.000 | 0.000
0.000 | 0.000
0.000 | 0.000
0.000 | 0.000
34peptides
spectra
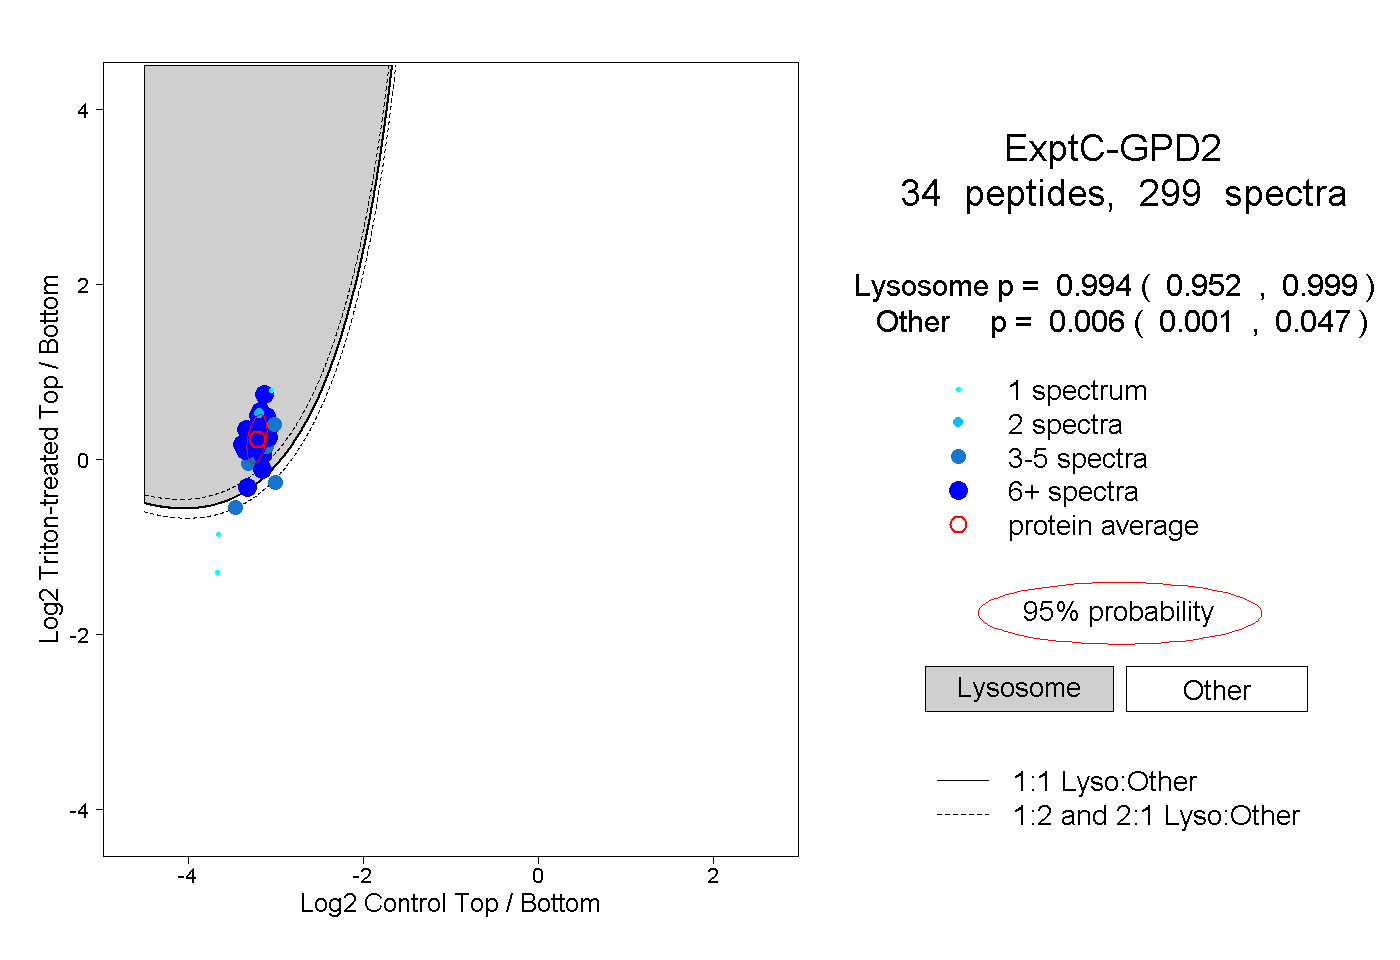
0.952 | 0.999
0.001 | 0.047
11peptides
spectra
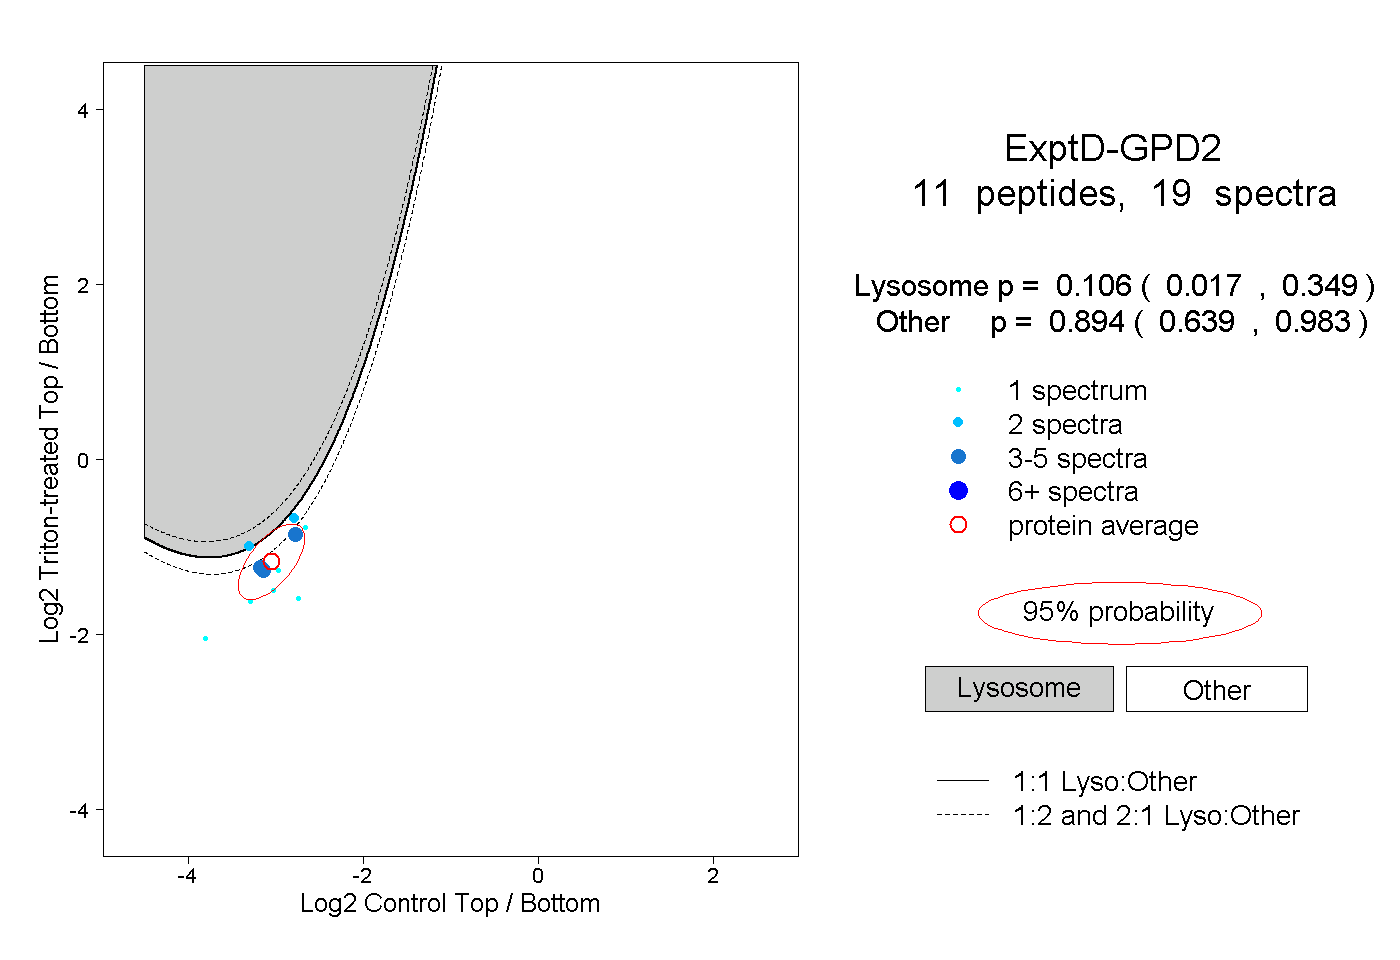
0.017 | 0.349
0.639 | 0.983