 26
26peptides
spectra
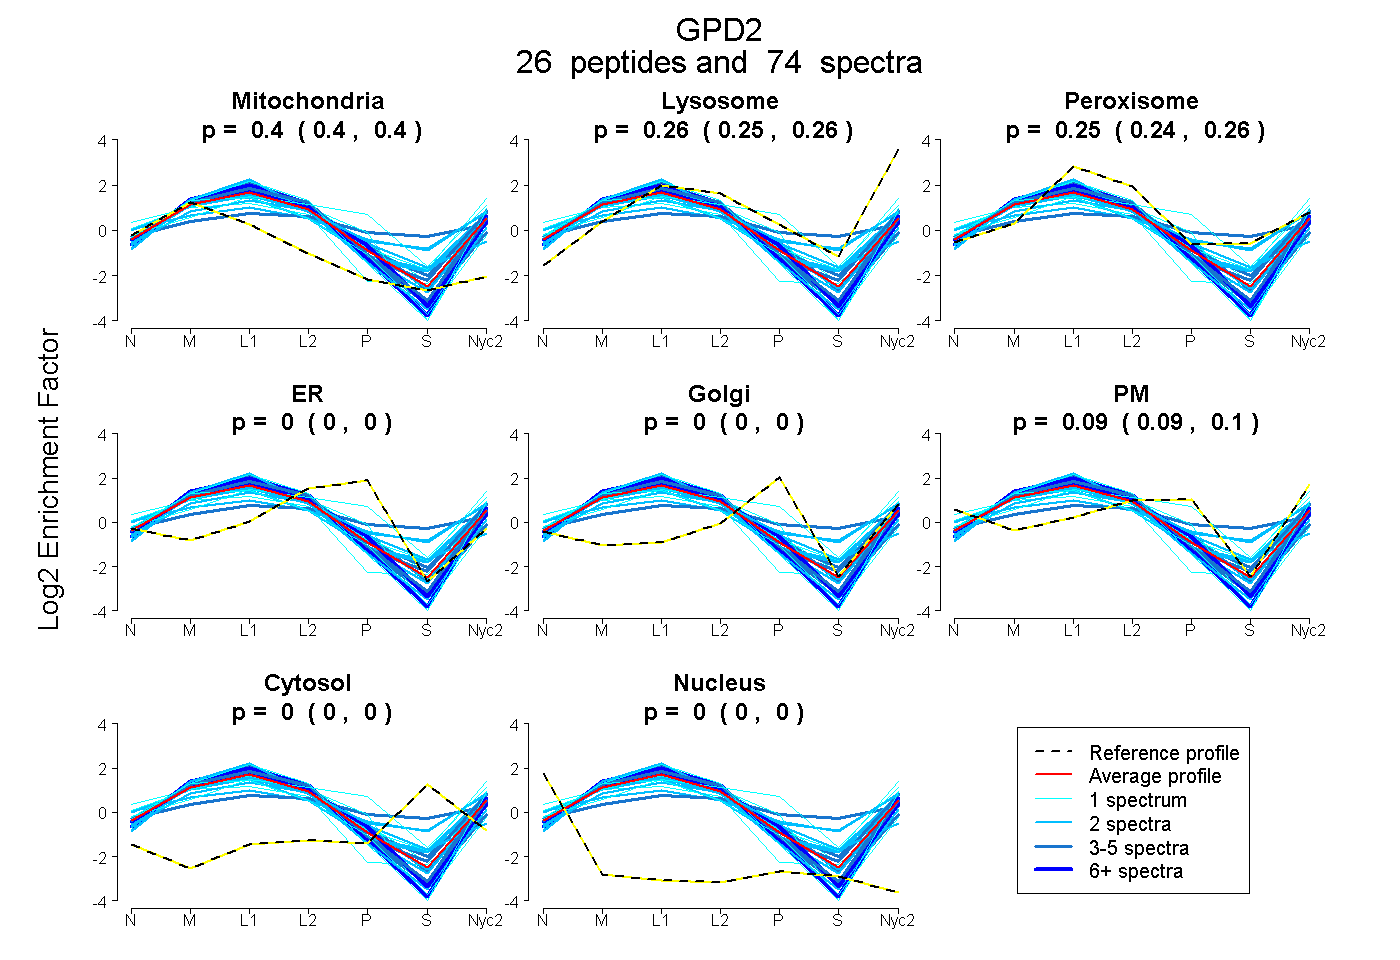
0.395 | 0.403
0.251 | 0.262
0.239 | 0.257
0.000 | 0.000
0.000 | 0.000
0.088 | 0.100
0.000 | 0.000
0.000 | 0.000
| Plot | Mito | Lyso | Perox | ER | Golgi | PM | Cytosol | Nucleus | |||||
| Expt A |
26 peptides |
74 spectra |
|
0.400 0.395 | 0.403 |
0.257 0.251 | 0.262 |
0.249 0.239 | 0.257 |
0.000 0.000 | 0.000 |
0.000 0.000 | 0.000 |
0.095 0.088 | 0.100 |
0.000 0.000 | 0.000 |
0.000 0.000 | 0.000 |
| 1 spectrum, EALHER | 0.348 | 0.312 | 0.229 | 0.064 | 0.000 | 0.047 | 0.000 | 0.000 | ||
| 5 spectra, ALEHFPMLQK | 0.382 | 0.267 | 0.209 | 0.028 | 0.000 | 0.114 | 0.000 | 0.000 | ||
| 1 spectrum, DWSPTLYIR | 0.458 | 0.407 | 0.036 | 0.000 | 0.000 | 0.099 | 0.000 | 0.000 | ||
| 2 spectra, NYLSCDVEVR | 0.365 | 0.003 | 0.501 | 0.131 | 0.000 | 0.000 | 0.000 | 0.000 | ||
| 1 spectrum, WPVVGVR | 0.599 | 0.227 | 0.019 | 0.079 | 0.000 | 0.076 | 0.000 | 0.000 | ||
| 14 spectra, SANTQSISR | 0.429 | 0.285 | 0.109 | 0.077 | 0.000 | 0.100 | 0.000 | 0.000 | ||
| 7 spectra, MNLAIALTAAR | 0.501 | 0.411 | 0.075 | 0.000 | 0.000 | 0.013 | 0.000 | 0.000 | ||
| 2 spectra, FLYYEMGYK | 0.421 | 0.266 | 0.265 | 0.000 | 0.000 | 0.048 | 0.000 | 0.000 | ||
| 2 spectra, FHMFDEDEK | 0.398 | 0.104 | 0.415 | 0.000 | 0.000 | 0.083 | 0.000 | 0.000 | ||
| 3 spectra, EYACTAVDMISR | 0.512 | 0.170 | 0.279 | 0.006 | 0.000 | 0.033 | 0.000 | 0.000 | ||
| 2 spectra, LVGAIVYYDGQHNDAR | 0.448 | 0.411 | 0.141 | 0.000 | 0.000 | 0.000 | 0.000 | 0.000 | ||
| 4 spectra, TAEENLDR | 0.414 | 0.265 | 0.226 | 0.000 | 0.000 | 0.095 | 0.000 | 0.000 | ||
| 2 spectra, LAILMK | 0.412 | 0.426 | 0.163 | 0.000 | 0.000 | 0.000 | 0.000 | 0.000 | ||
| 3 spectra, LVSEFPYIEAEVK | 0.353 | 0.290 | 0.356 | 0.000 | 0.000 | 0.000 | 0.000 | 0.000 | ||
| 5 spectra, LHNLNAGPSR | 0.103 | 0.000 | 0.486 | 0.000 | 0.116 | 0.108 | 0.187 | 0.000 | ||
| 2 spectra, TVGLFLQGGK | 0.240 | 0.274 | 0.368 | 0.000 | 0.000 | 0.054 | 0.064 | 0.000 | ||
| 1 spectrum, VPIPVDR | 0.072 | 0.160 | 0.326 | 0.129 | 0.005 | 0.309 | 0.000 | 0.000 | ||
| 1 spectrum, DVLTGHEFNVR | 0.550 | 0.075 | 0.312 | 0.000 | 0.000 | 0.064 | 0.000 | 0.000 | ||
| 4 spectra, ELNWSELR | 0.350 | 0.231 | 0.388 | 0.000 | 0.000 | 0.031 | 0.000 | 0.000 | ||
| 3 spectra, IVELMGR | 0.449 | 0.433 | 0.079 | 0.000 | 0.000 | 0.038 | 0.000 | 0.000 | ||
| 2 spectra, MYDLVAGSHCLK | 0.521 | 0.274 | 0.205 | 0.000 | 0.000 | 0.000 | 0.000 | 0.000 | ||
| 2 spectra, GFITIVDVQR | 0.401 | 0.274 | 0.325 | 0.000 | 0.000 | 0.000 | 0.000 | 0.000 | ||
| 1 spectrum, LVQDYGLESEVAQHLAK | 0.305 | 0.433 | 0.213 | 0.000 | 0.000 | 0.049 | 0.000 | 0.000 | ||
| 1 spectrum, MASVTGK | 0.347 | 0.118 | 0.072 | 0.121 | 0.000 | 0.343 | 0.000 | 0.000 | ||
| 1 spectrum, VIFFLPWEK | 0.454 | 0.366 | 0.108 | 0.000 | 0.000 | 0.072 | 0.000 | 0.000 | ||
| 2 spectra, LAFLNVQAAEEALPK | 0.214 | 0.148 | 0.309 | 0.000 | 0.000 | 0.245 | 0.084 | 0.000 |
| Plot | Mito | Lyso or Perox | ER | Golgi | PM | Cytosol | Nucleus | ||||||
| Expt B |
6 peptides |
9 spectra |
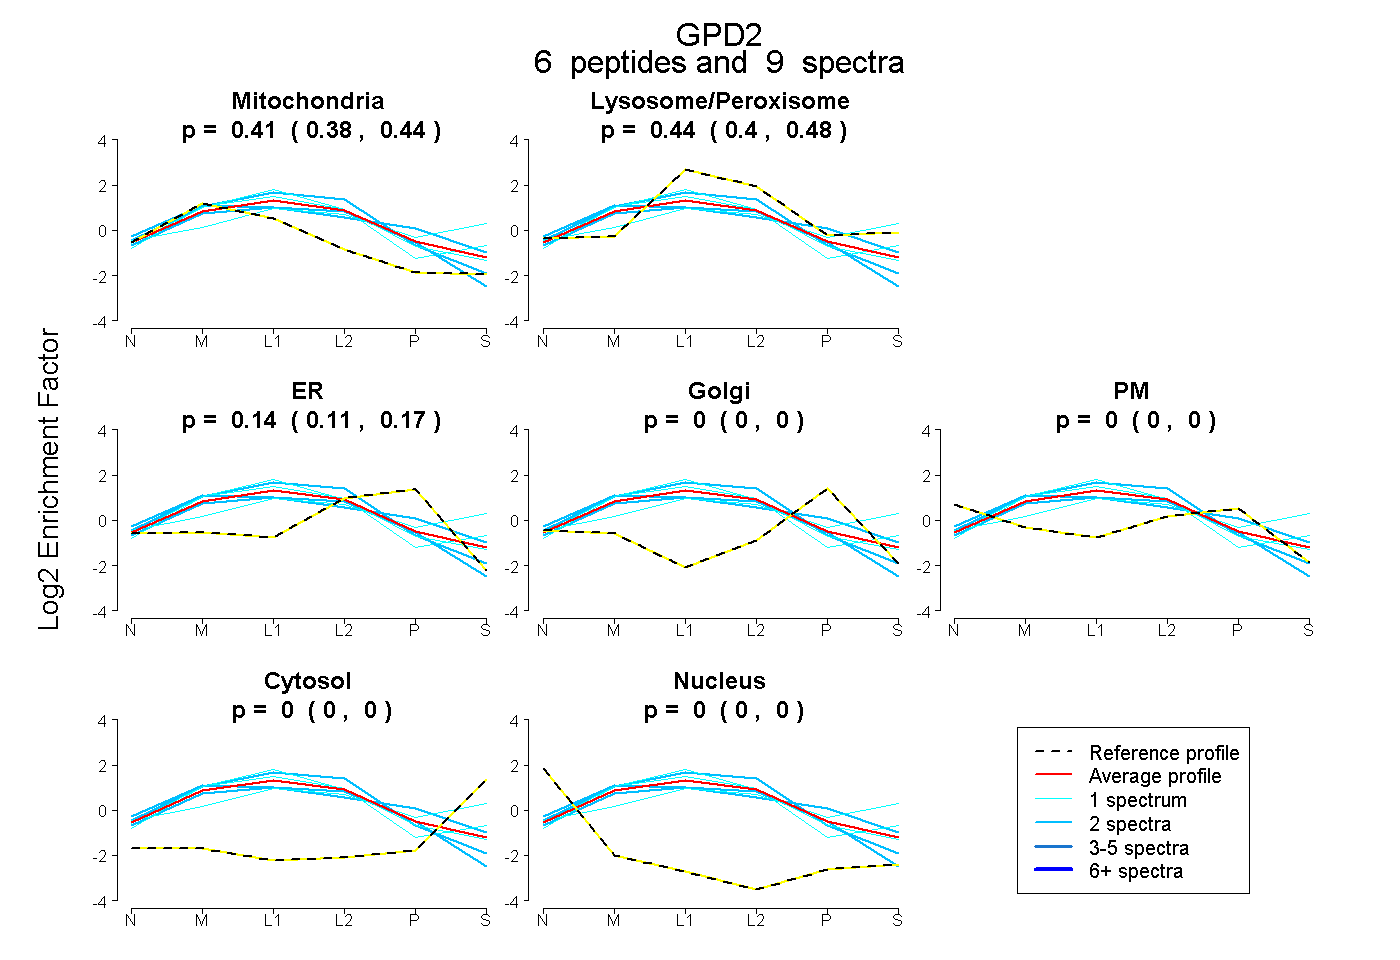 |
0.413 0.382 | 0.438 |
0.443 0.403 | 0.476 |
0.145 0.111 | 0.174 |
0.000 0.000 | 0.000 |
0.000 0.000 | 0.000 |
0.000 0.000 | 0.000 |
0.000 0.000 | 0.000 |
|||
| Plot | Lyso | Other | |||||||||||
| Expt C |
34 peptides |
299 spectra |
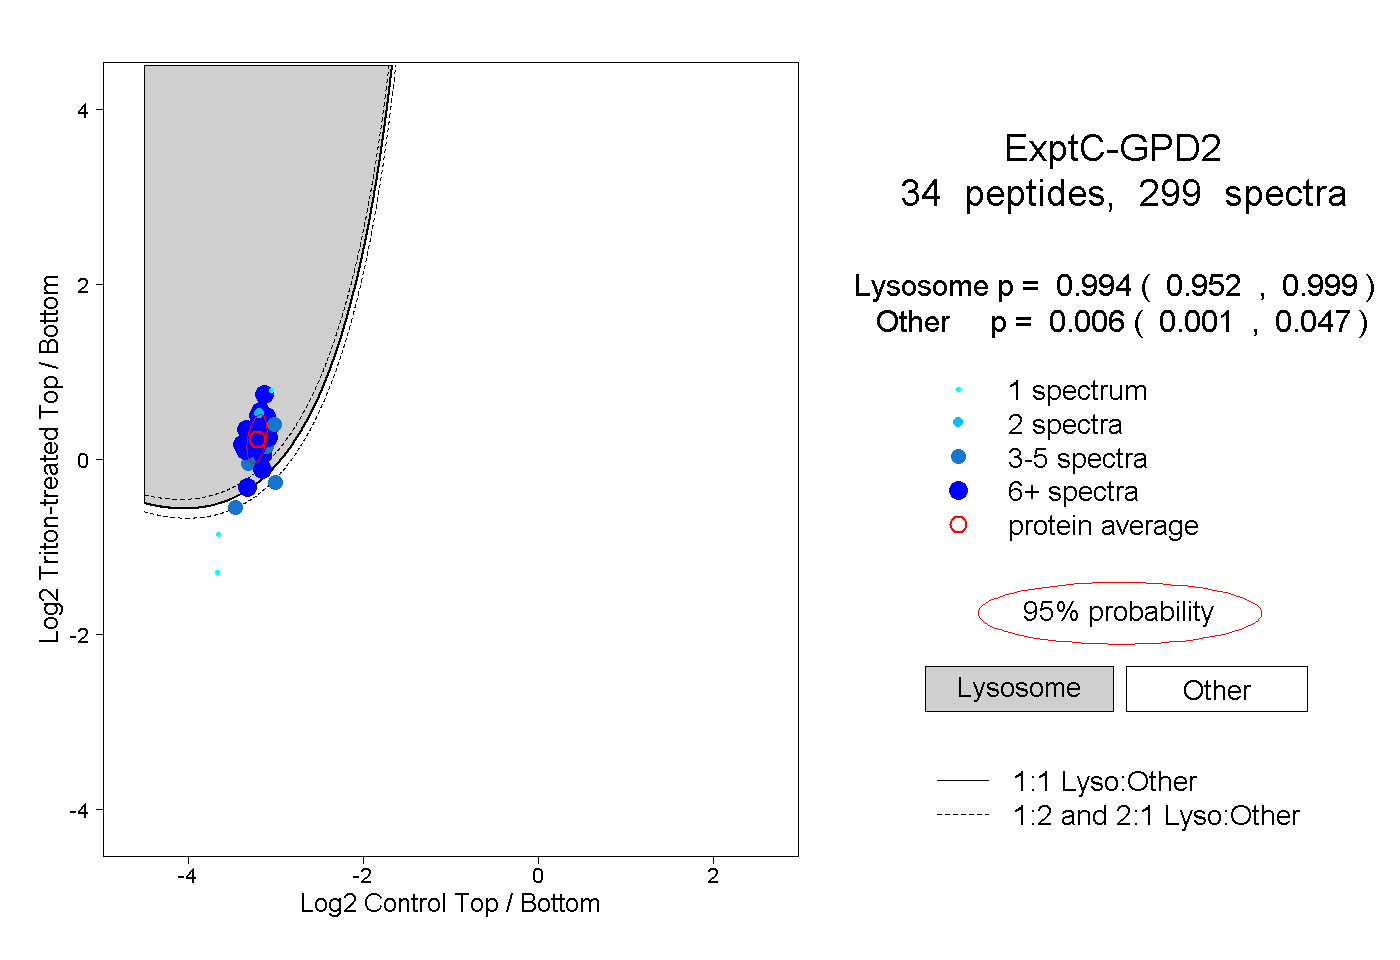 |
0.994 0.952 | 0.999 |
0.006 0.001 | 0.047 |
||||||||
| Plot | Lyso | Other | |||||||||||
| Expt D |
11 peptides |
19 spectra |
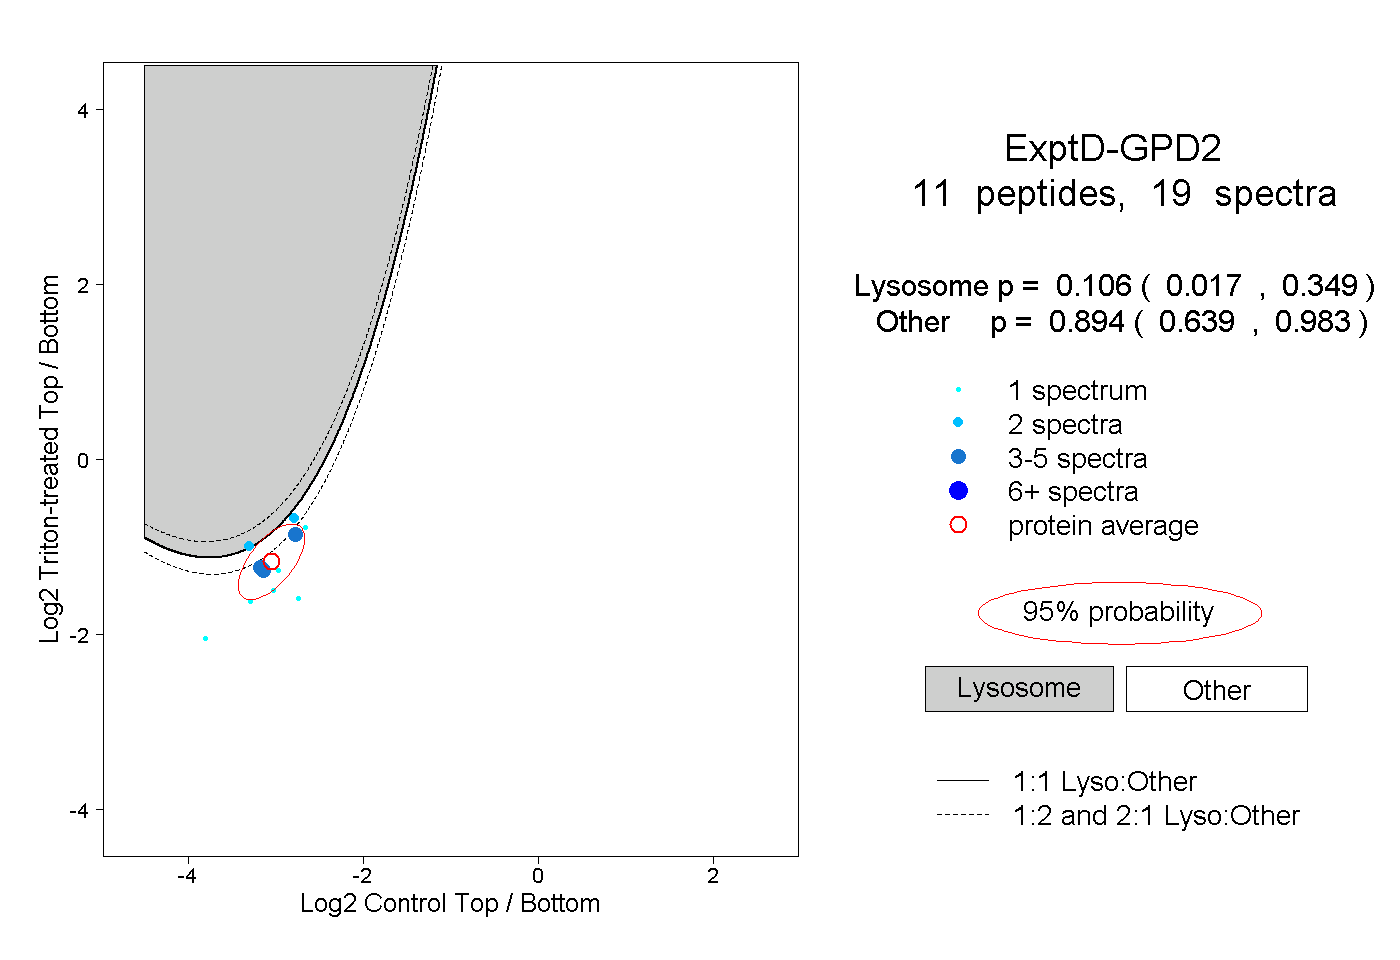 |
0.106 0.017 | 0.349 |
0.894 0.639 | 0.983 |