 7
7peptides
spectra
0.046 | 0.114
0.000 | 0.000
0.000 | 0.000
0.000 | 0.000
0.000 | 0.000
0.403 | 0.454
0.437 | 0.471
0.008 | 0.048
| Plot | Mito | Lyso | Perox | ER | Golgi | PM | Cytosol | Nucleus | |||||
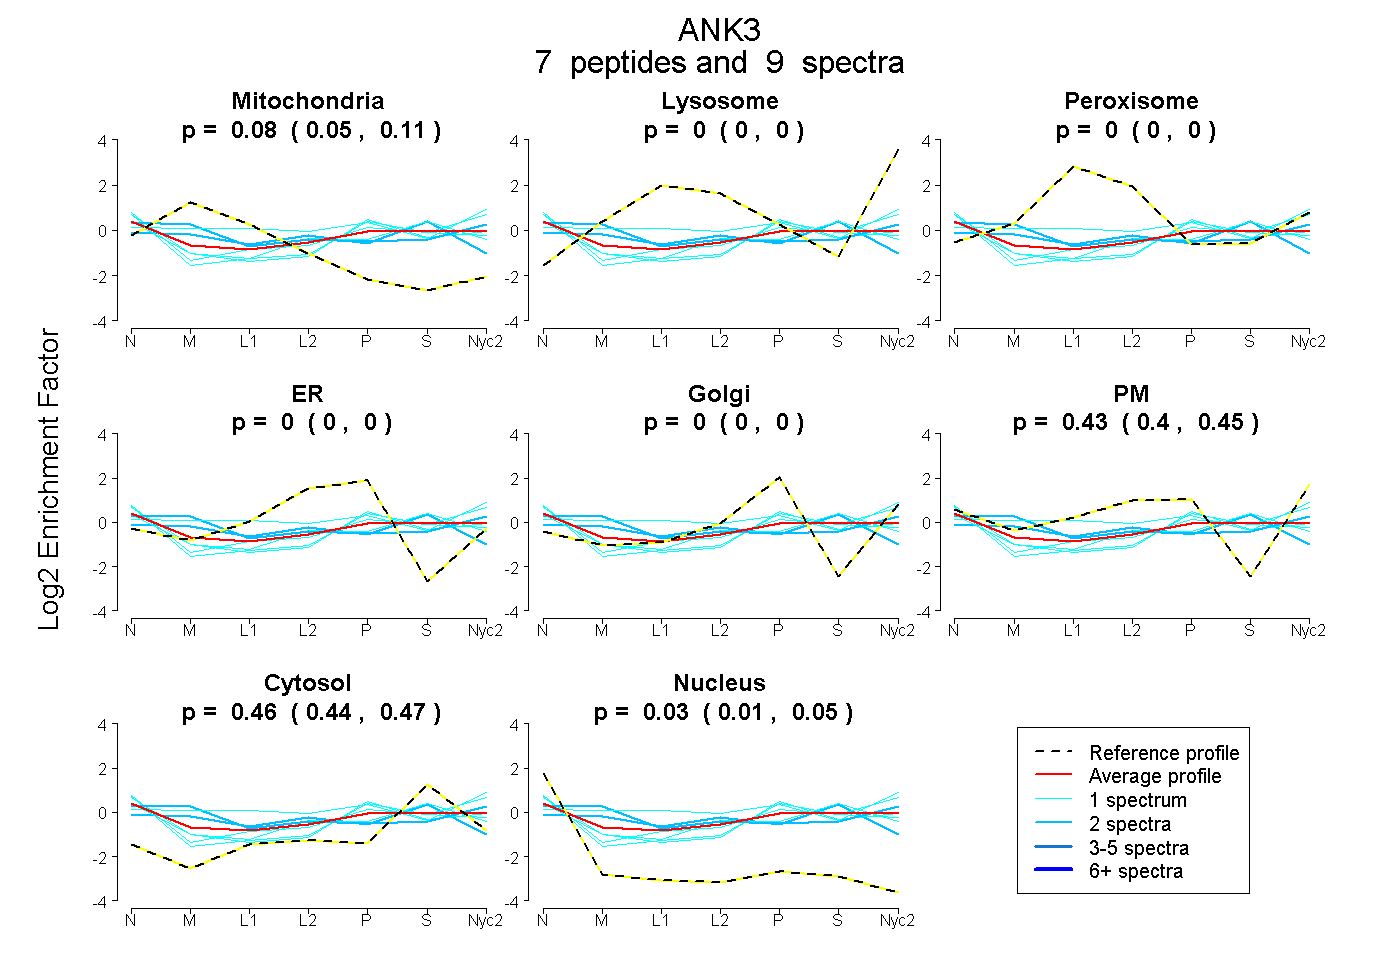
| Expt A |
7 peptides |
9 spectra |
|
0.081 0.046 | 0.114 |
0.000 0.000 | 0.000 |
0.000 0.000 | 0.000 |
0.000 0.000 | 0.000 |
0.000 0.000 | 0.000 |
0.432 0.403 | 0.454 |
0.457 0.437 | 0.471 |
0.030 0.008 | 0.048 |
| 1 spectrum, SGQAEVVR | 0.000 | 0.000 | 0.000 | 0.000 | 0.204 | 0.244 | 0.430 | 0.122 | ||
| 1 spectrum, LEVASLLLQK | 0.000 | 0.000 | 0.000 | 0.000 | 0.000 | 0.509 | 0.447 | 0.044 | ||
| 1 spectrum, EGHVEVVSELLQR | 0.019 | 0.000 | 0.022 | 0.000 | 0.000 | 0.342 | 0.550 | 0.067 | ||
| 1 spectrum, VGLQAQPVPEETVK | 0.064 | 0.093 | 0.102 | 0.000 | 0.000 | 0.460 | 0.282 | 0.000 | ||
| 2 spectra, AGHLEK | 0.229 | 0.000 | 0.134 | 0.100 | 0.000 | 0.054 | 0.483 | 0.000 | ||
| 2 spectra, TLEQQENFEEVAR | 0.239 | 0.021 | 0.000 | 0.000 | 0.000 | 0.402 | 0.337 | 0.000 | ||
| 1 spectrum, LGYISVVDTLK | 0.000 | 0.000 | 0.000 | 0.000 | 0.254 | 0.254 | 0.366 | 0.125 |
| Plot | Mito | Lyso or Perox | ER | Golgi | PM | Cytosol | Nucleus | ||||||
| Expt B |
1 peptide |
1 spectrum |
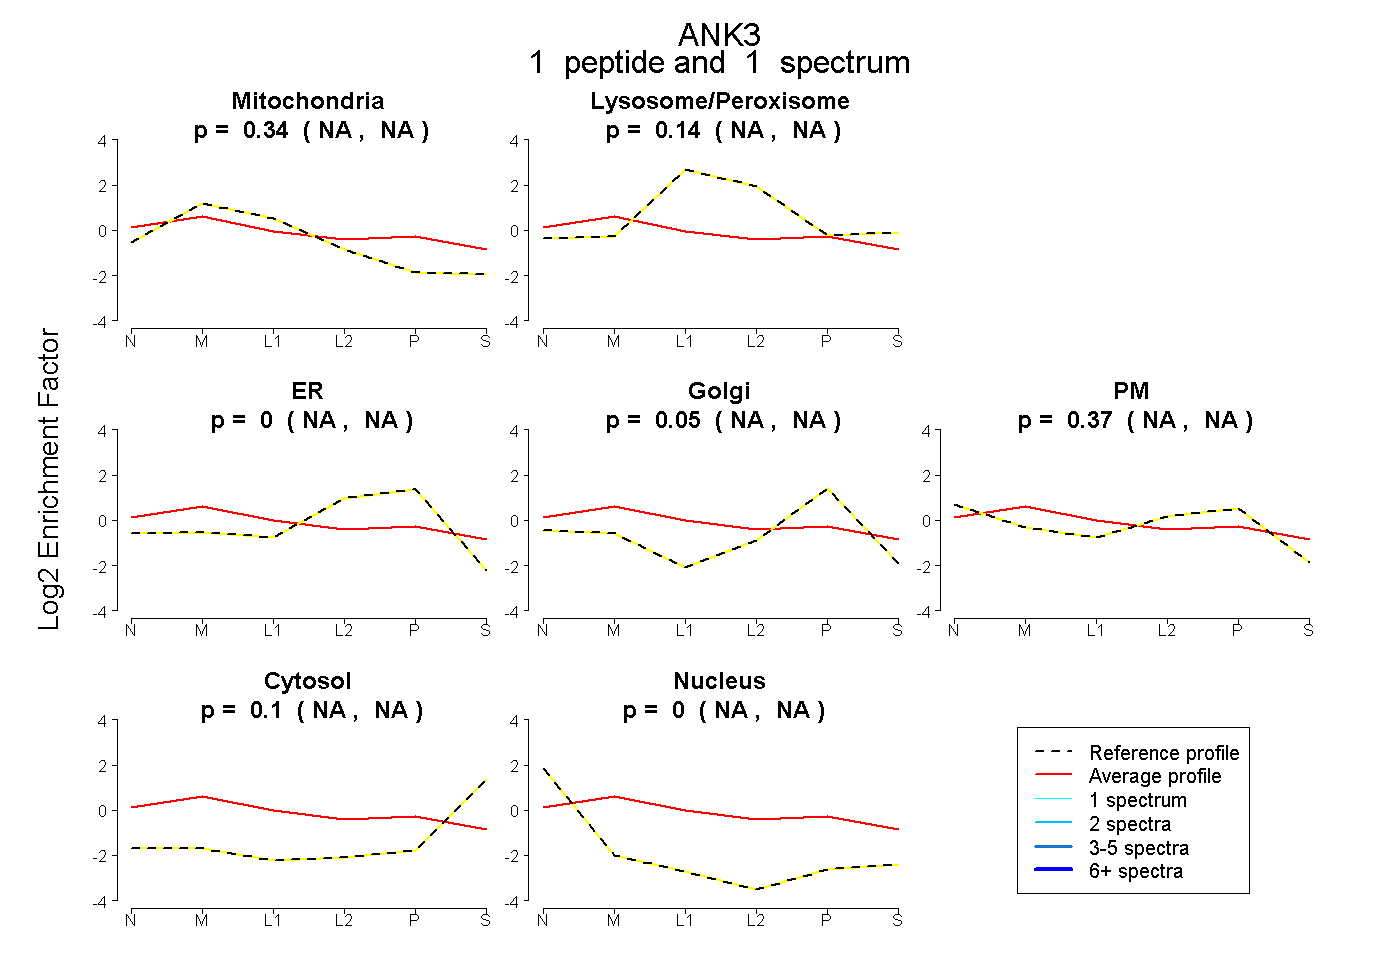 |
0.337 NA | NA |
0.144 NA | NA |
0.000 NA | NA |
0.050 NA | NA |
0.373 NA | NA |
0.096 NA | NA |
0.000 NA | NA |
|||
| Plot | Lyso | Other | |||||||||||
| Expt C |
6 peptides |
37 spectra |
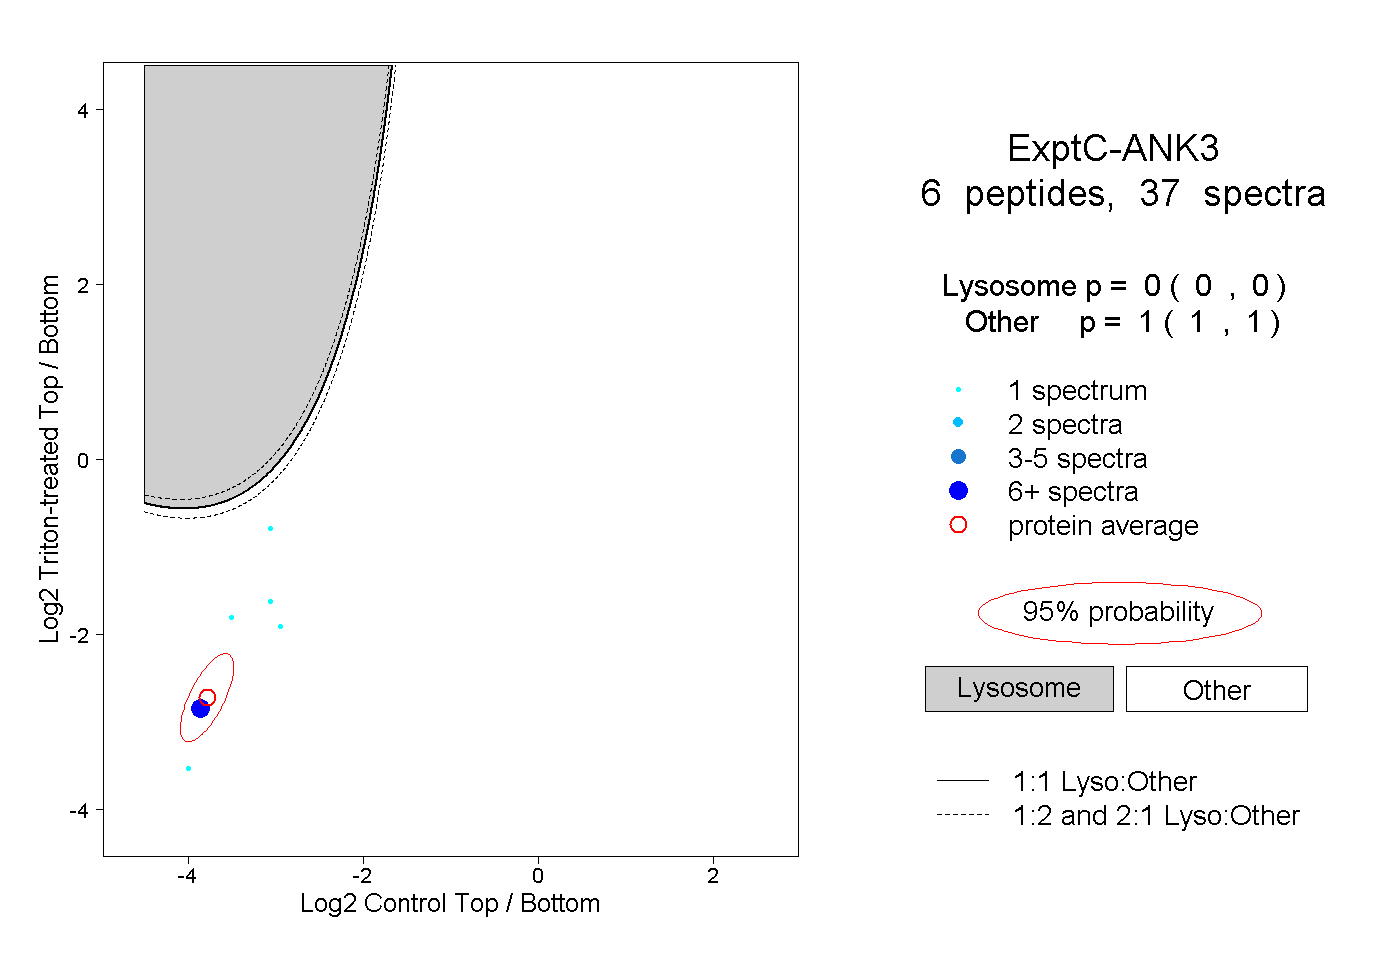 |
0.000 0.000 | 0.000 |
1.000 1.000 | 1.000 |
||||||||
| Plot | Lyso | Other | |||||||||||
| Expt D |
2 peptides |
3 spectra |
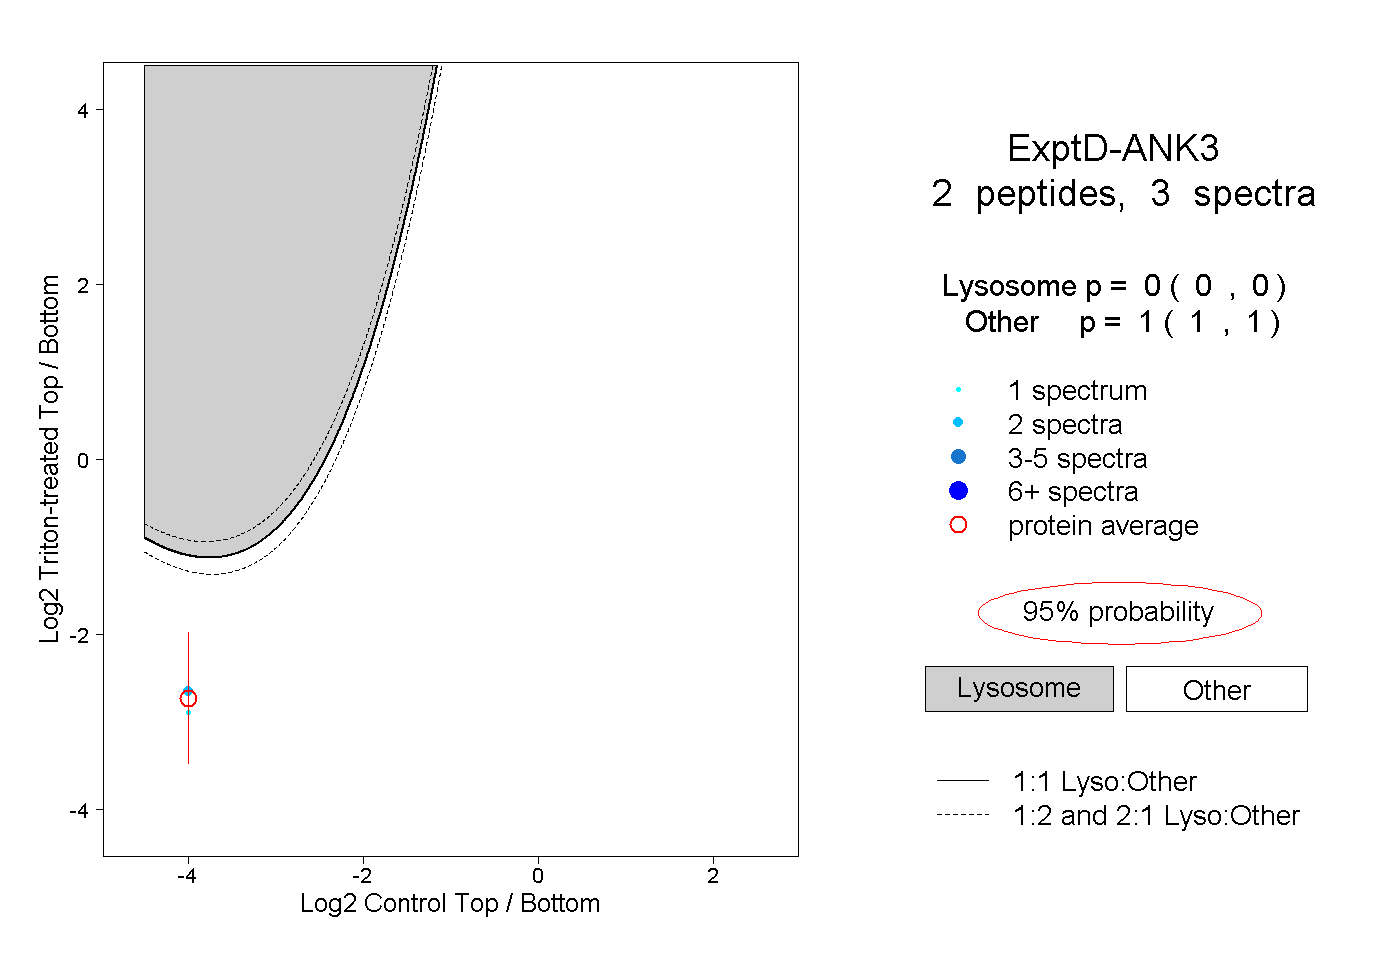 |
0.000 0.000 | 0.000 |
1.000 1.000 | 1.000 |