 2
2peptides
spectra
0.000 | 0.462
0.000 | 0.000
0.000 | 0.344
0.000 | 0.099
0.000 | 0.039
0.000 | 0.133
0.182 | 0.402
0.070 | 0.406
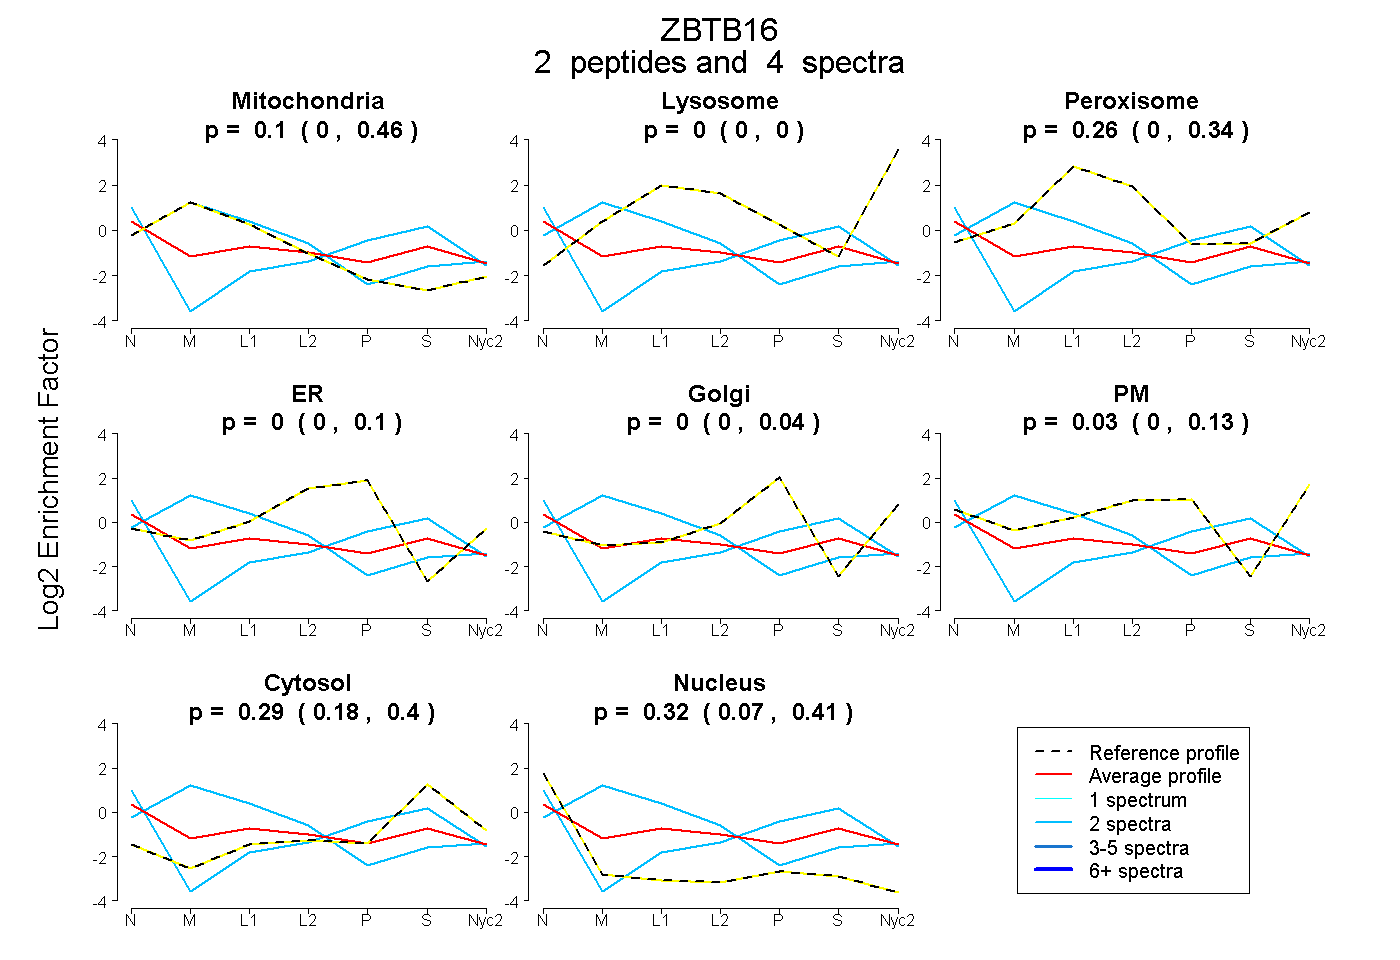
| Plot | Mito | Lyso | Perox | ER | Golgi | PM | Cytosol | Nucleus | |||||
| Expt A |
2 peptides |
4 spectra |
|
0.101 0.000 | 0.462 |
0.000 0.000 | 0.000 |
0.257 0.000 | 0.344 |
0.000 0.000 | 0.099 |
0.000 0.000 | 0.039 |
0.032 0.000 | 0.133 |
0.291 0.182 | 0.402 |
0.319 0.070 | 0.406 |