 24
24peptides
spectra
0.000 | 0.000
0.406 | 0.416
0.000 | 0.000
0.000 | 0.000
0.170 | 0.178
0.000 | 0.000
0.410 | 0.417
0.000 | 0.000
| Plot | Mito | Lyso | Perox | ER | Golgi | PM | Cytosol | Nucleus | |||||
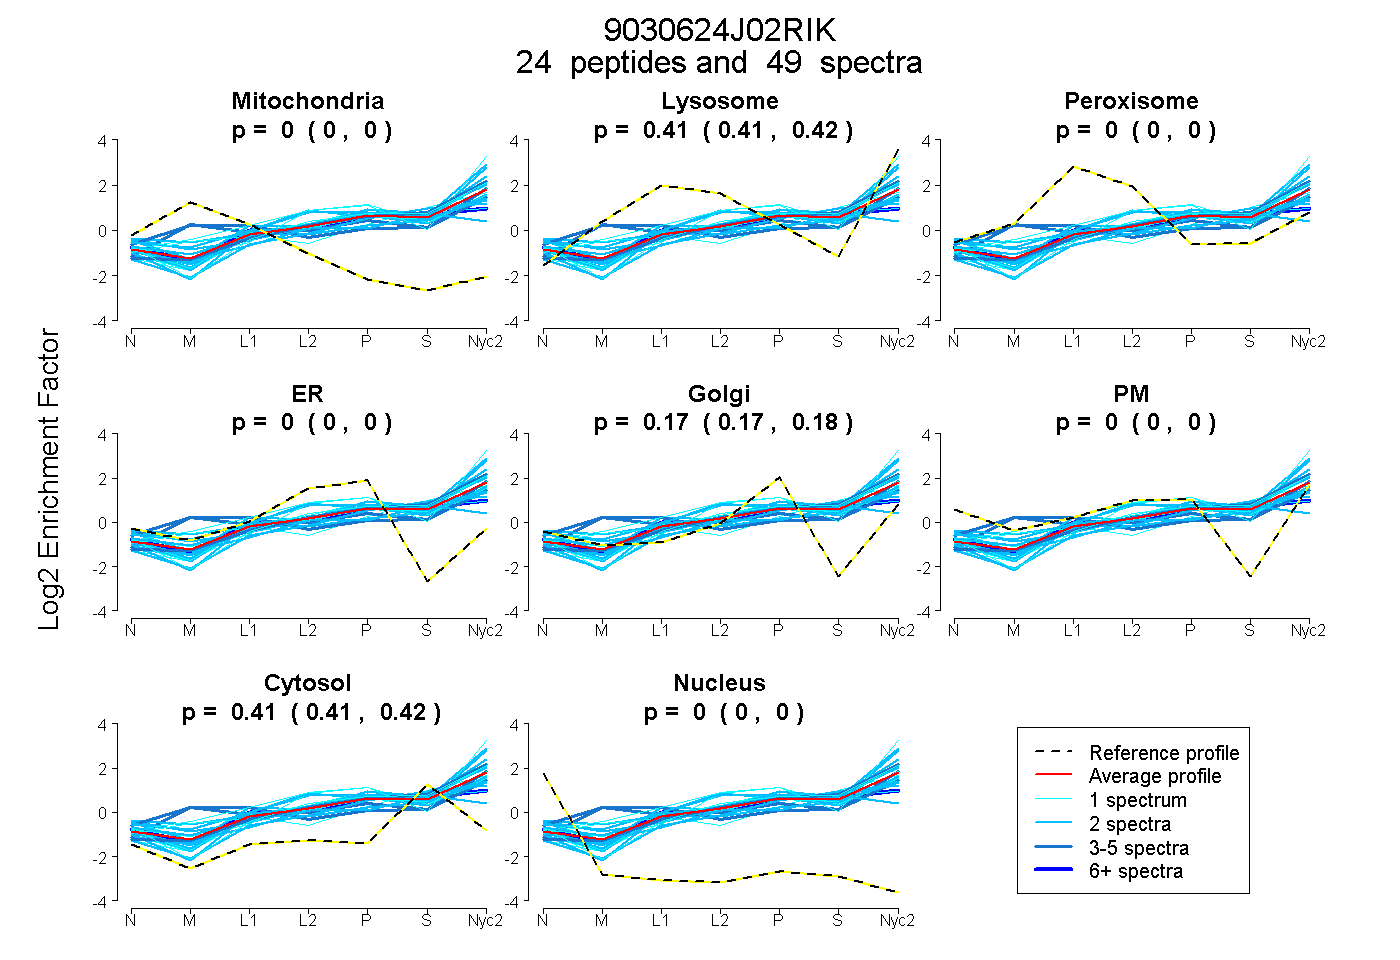
| Expt A |
24 peptides |
49 spectra |
|
0.000 0.000 | 0.000 |
0.412 0.406 | 0.416 |
0.000 0.000 | 0.000 |
0.000 0.000 | 0.000 |
0.175 0.170 | 0.178 |
0.000 0.000 | 0.000 |
0.414 0.410 | 0.417 |
0.000 0.000 | 0.000 |
| 2 spectra, LAMETR | 0.000 | 0.394 | 0.000 | 0.000 | 0.216 | 0.000 | 0.390 | 0.000 | ||
| 2 spectra, ELLNLTQQDYVNR | 0.000 | 0.305 | 0.000 | 0.000 | 0.000 | 0.254 | 0.442 | 0.000 | ||
| 2 spectra, DAWASDQK | 0.000 | 0.288 | 0.000 | 0.000 | 0.125 | 0.204 | 0.383 | 0.000 | ||
| 1 spectrum, MLAHLINGFIK | 0.000 | 0.656 | 0.000 | 0.000 | 0.195 | 0.000 | 0.149 | 0.000 | ||
| 2 spectra, LCEAAMVQILEHLK | 0.000 | 0.368 | 0.000 | 0.000 | 0.166 | 0.000 | 0.466 | 0.000 | ||
| 2 spectra, EVNTVLADVIK | 0.000 | 0.499 | 0.000 | 0.000 | 0.121 | 0.000 | 0.380 | 0.000 | ||
| 1 spectrum, LQILNEAWK | 0.000 | 0.455 | 0.000 | 0.000 | 0.167 | 0.000 | 0.378 | 0.000 | ||
| 2 spectra, LSINLFMGSEK | 0.000 | 0.271 | 0.000 | 0.000 | 0.155 | 0.000 | 0.574 | 0.000 | ||
| 2 spectra, FLPFLDMFQK | 0.000 | 0.544 | 0.000 | 0.000 | 0.117 | 0.000 | 0.340 | 0.000 | ||
| 1 spectrum, VGMEVAPHLK | 0.000 | 0.381 | 0.000 | 0.000 | 0.181 | 0.000 | 0.437 | 0.000 | ||
| 3 spectra, GIGDPLVSVYAR | 0.086 | 0.425 | 0.000 | 0.000 | 0.024 | 0.121 | 0.345 | 0.000 | ||
| 2 spectra, TGISECLPR | 0.000 | 0.350 | 0.000 | 0.000 | 0.234 | 0.010 | 0.406 | 0.000 | ||
| 7 spectra, AELASCR | 0.000 | 0.290 | 0.048 | 0.000 | 0.198 | 0.000 | 0.464 | 0.000 | ||
| 2 spectra, LNQLSVNLWHLAQR | 0.000 | 0.078 | 0.057 | 0.000 | 0.000 | 0.284 | 0.580 | 0.000 | ||
| 2 spectra, DFEQQLSFYVESR | 0.000 | 0.431 | 0.000 | 0.000 | 0.145 | 0.000 | 0.424 | 0.000 | ||
| 1 spectrum, LLSDTSVIQFYPSK | 0.000 | 0.424 | 0.000 | 0.000 | 0.193 | 0.000 | 0.383 | 0.000 | ||
| 2 spectra, IEELNQSLK | 0.000 | 0.533 | 0.000 | 0.000 | 0.001 | 0.172 | 0.294 | 0.000 | ||
| 1 spectrum, AFEDSYPQLQSIIK | 0.000 | 0.371 | 0.000 | 0.000 | 0.056 | 0.000 | 0.573 | 0.000 | ||
| 1 spectrum, FYVEASILK | 0.000 | 0.359 | 0.000 | 0.007 | 0.310 | 0.000 | 0.323 | 0.000 | ||
| 1 spectrum, ETCLNWFFK | 0.000 | 0.286 | 0.000 | 0.000 | 0.200 | 0.000 | 0.514 | 0.000 | ||
| 3 spectra, VDSNDSLYGGDSR | 0.000 | 0.460 | 0.000 | 0.000 | 0.106 | 0.000 | 0.435 | 0.000 | ||
| 2 spectra, LPLQTR | 0.000 | 0.319 | 0.000 | 0.000 | 0.209 | 0.000 | 0.471 | 0.000 | ||
| 3 spectra, AGAAASAMSEK | 0.000 | 0.503 | 0.000 | 0.000 | 0.170 | 0.000 | 0.326 | 0.000 | ||
| 2 spectra, AEFIATR | 0.000 | 0.424 | 0.000 | 0.000 | 0.142 | 0.000 | 0.434 | 0.000 |
| Plot | Mito | Lyso or Perox | ER | Golgi | PM | Cytosol | Nucleus | ||||||
| Expt B |
9 peptides |
11 spectra |
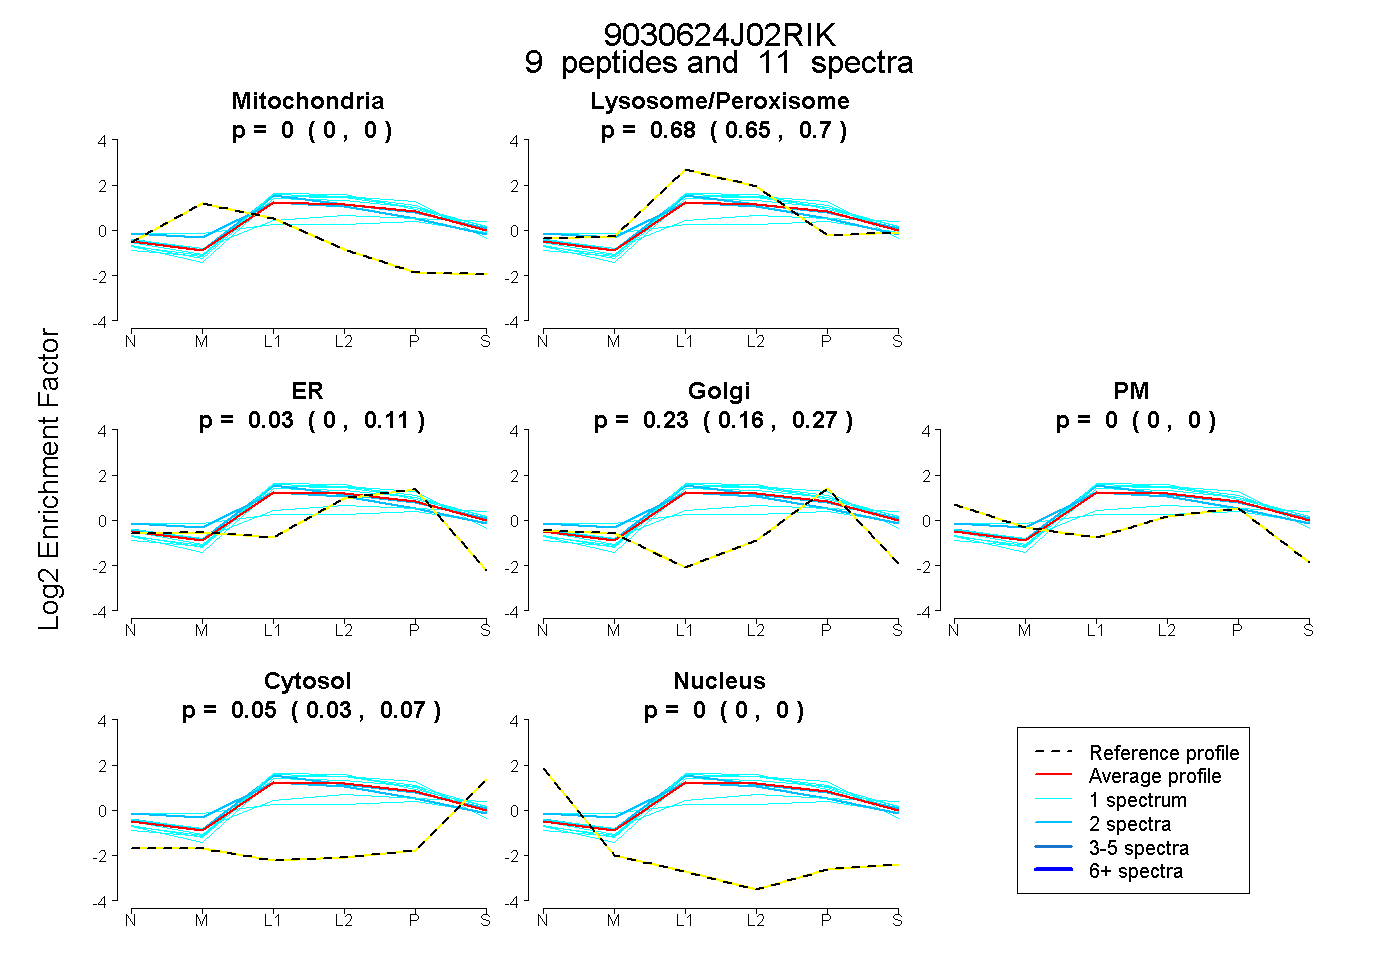 |
0.000 0.000 | 0.000 |
0.683 0.649 | 0.704 |
0.034 0.000 | 0.109 |
0.234 0.156 | 0.269 |
0.000 0.000 | 0.000 |
0.048 0.031 | 0.067 |
0.000 0.000 | 0.000 |
|||
| Plot | Lyso | Other | |||||||||||
| Expt C |
32 peptides |
109 spectra |
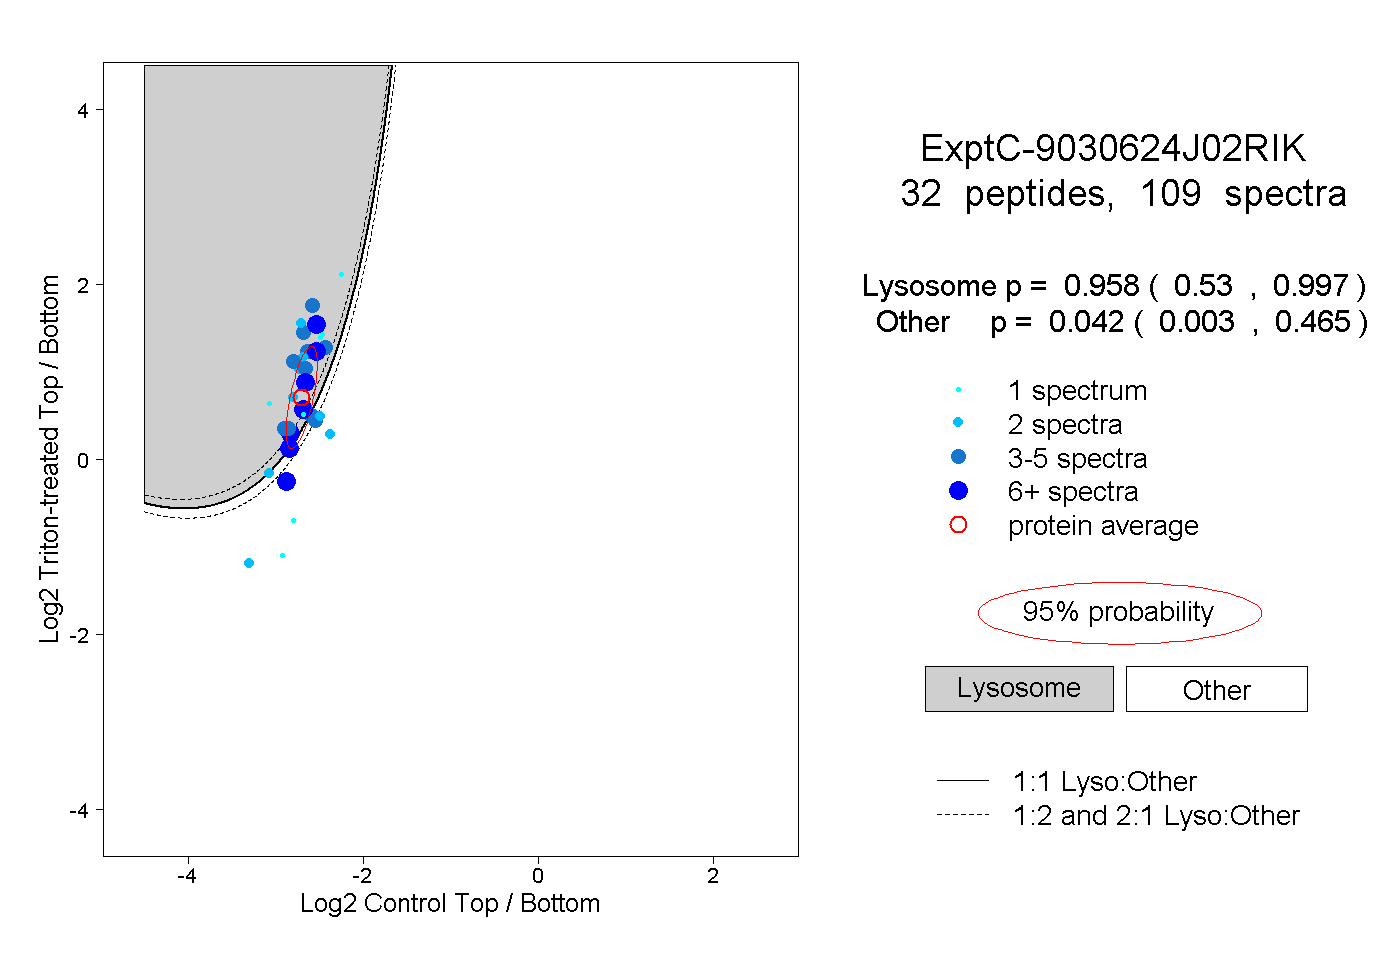 |
0.958 0.530 | 0.997 |
0.042 0.003 | 0.465 |
||||||||
| Plot | Lyso | Other | |||||||||||
| Expt D |
9 peptides |
14 spectra |
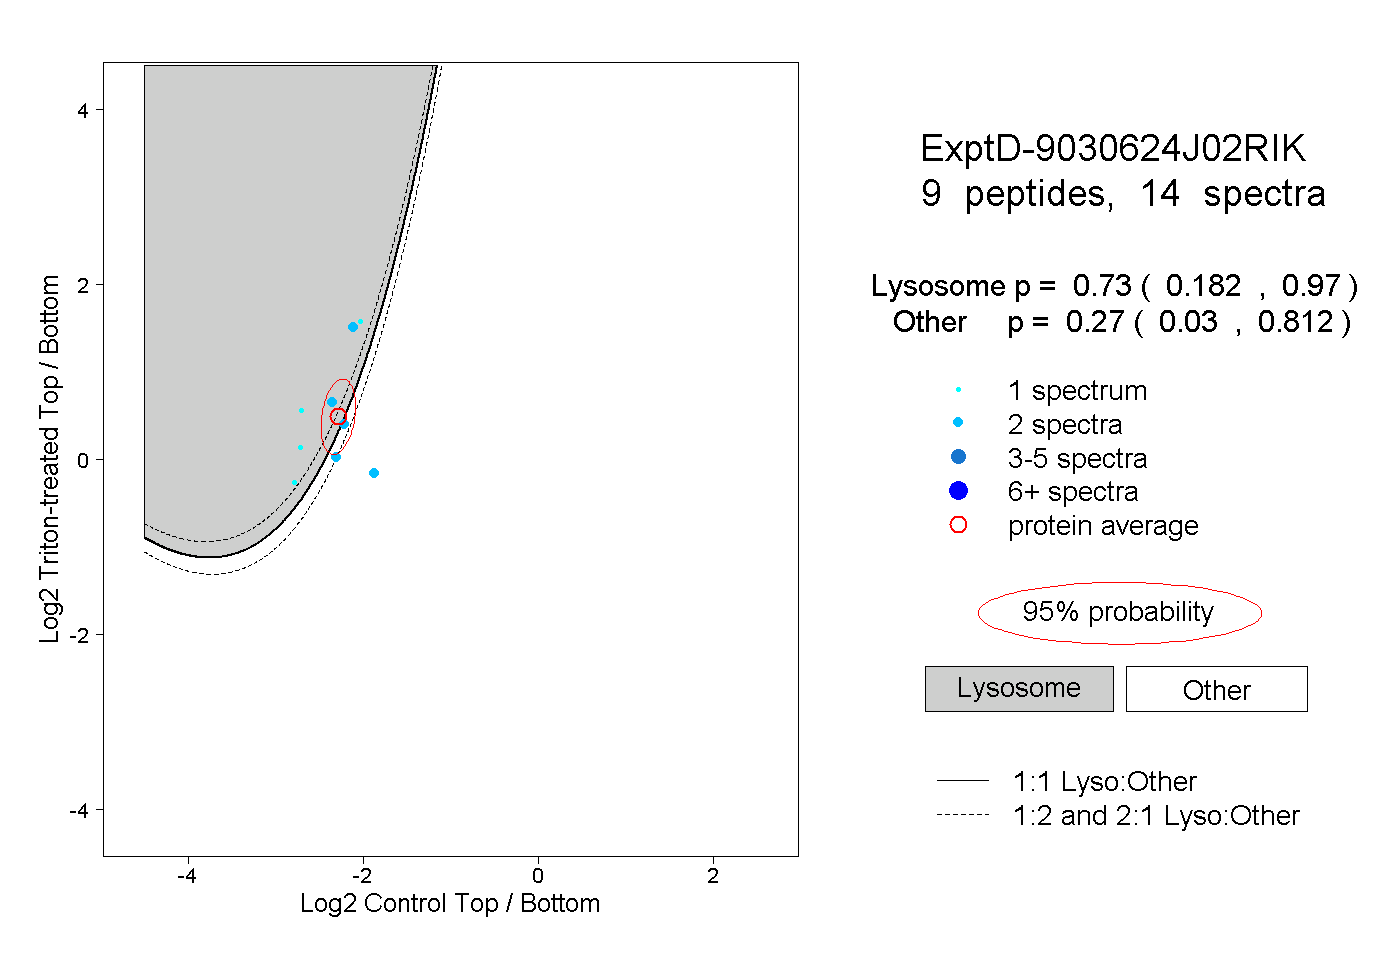 |
0.730 0.182 | 0.970 |
0.270 0.030 | 0.812 |