8
8peptides
spectra
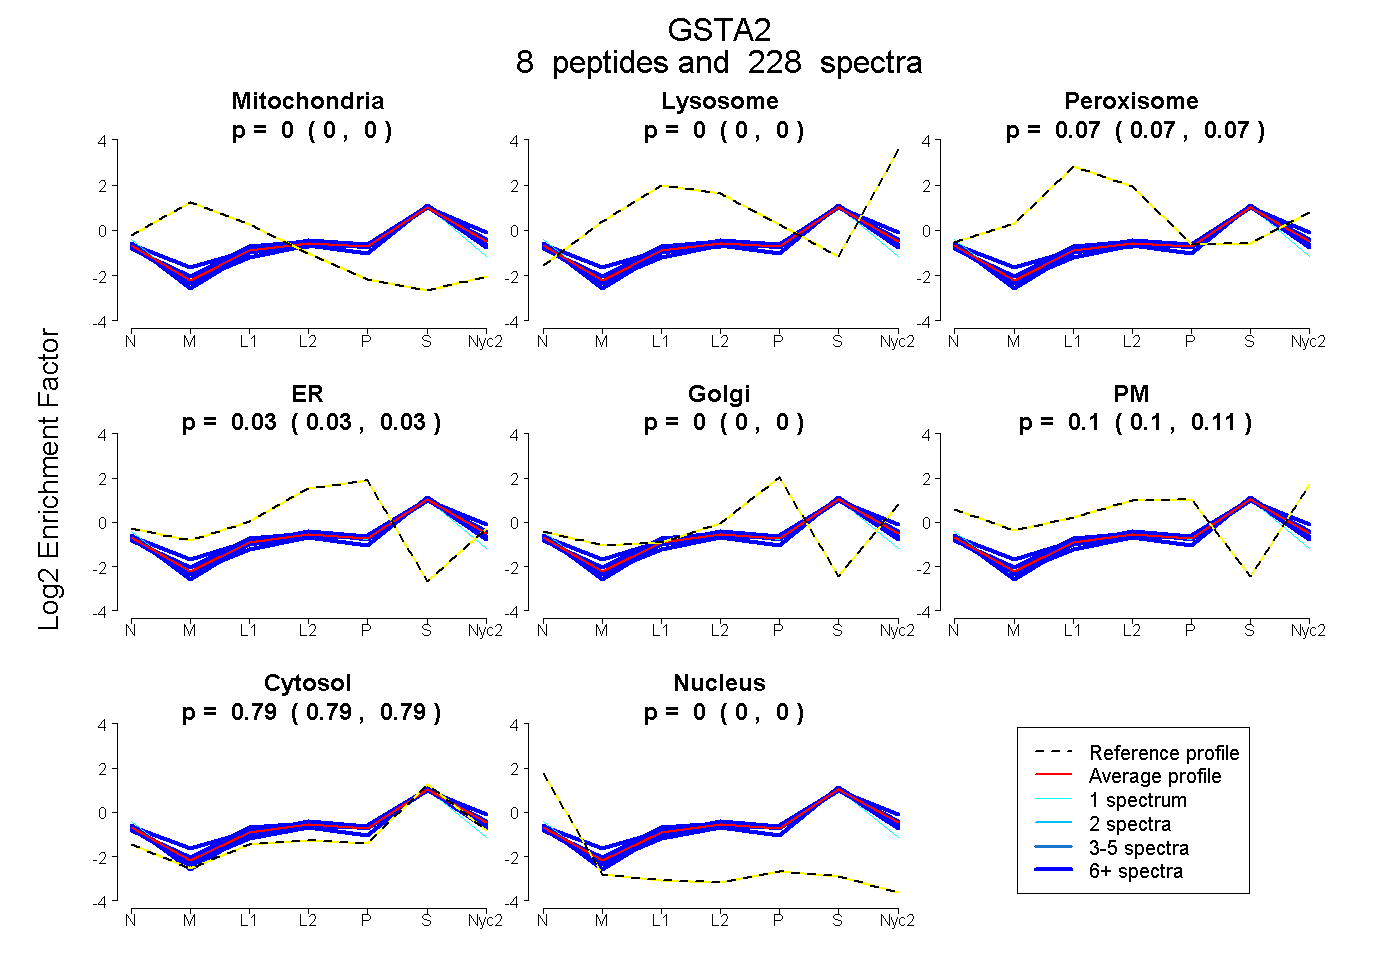
0.000 | 0.000
0.000 | 0.000
0.071 | 0.074
0.027 | 0.034
0.000 | 0.000
0.098 | 0.106
0.792 | 0.795
0.000 | 0.000
10peptides
spectra
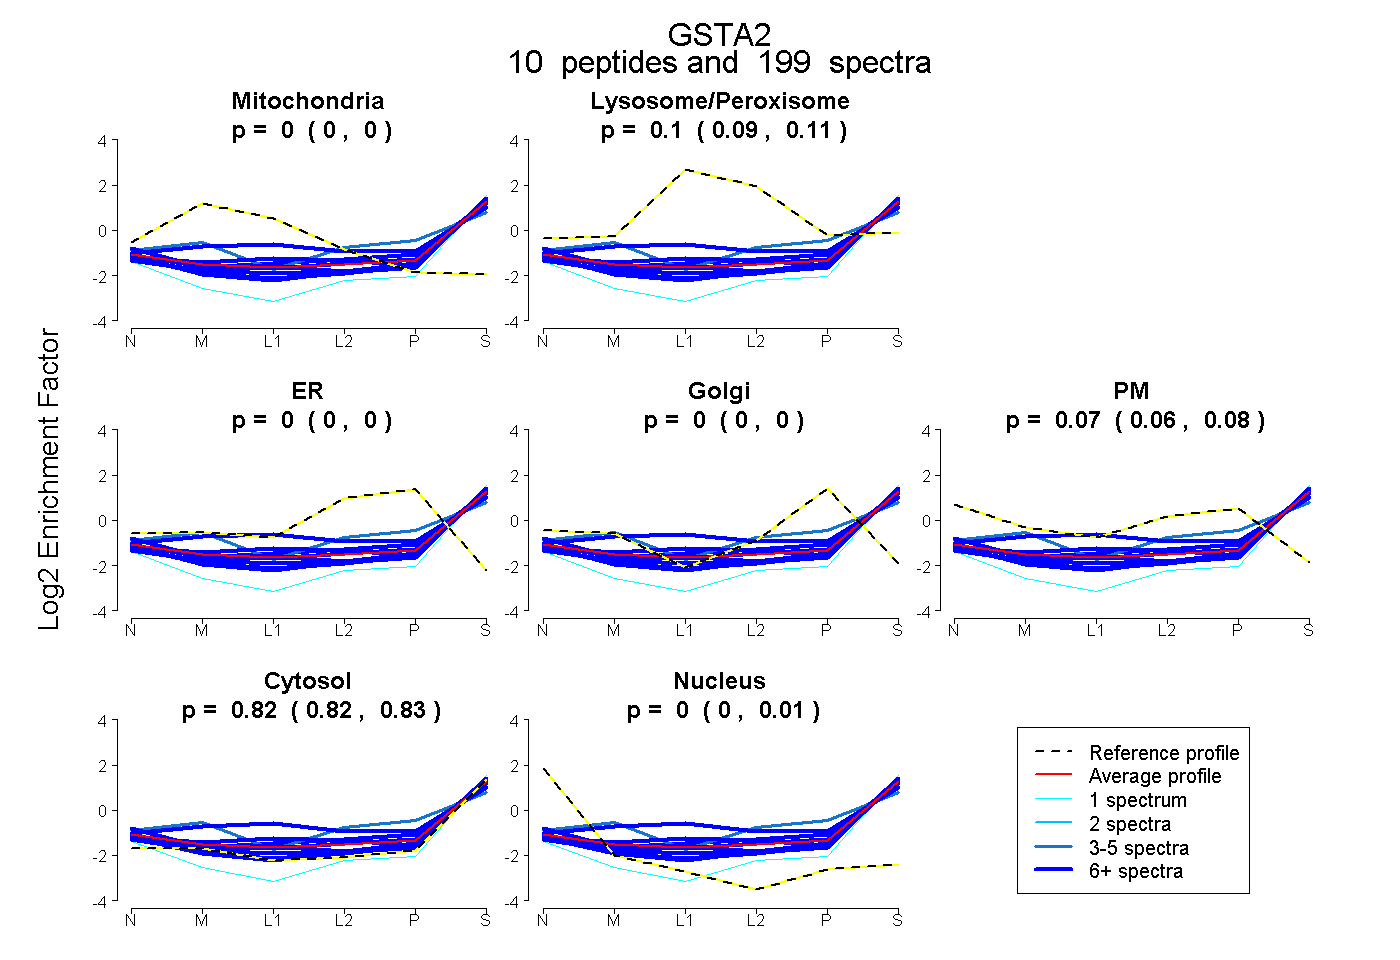
0.000 | 0.000
0.094 | 0.105
0.000 | 0.000
0.000 | 0.000
0.064 | 0.078
0.821 | 0.826
0.000 | 0.008