 8
8peptides
spectra
0.000 | 0.000
0.000 | 0.000
0.071 | 0.074
0.027 | 0.034
0.000 | 0.000
0.098 | 0.106
0.792 | 0.795
0.000 | 0.000
| Plot | Mito | Lyso | Perox | ER | Golgi | PM | Cytosol | Nucleus | |||||
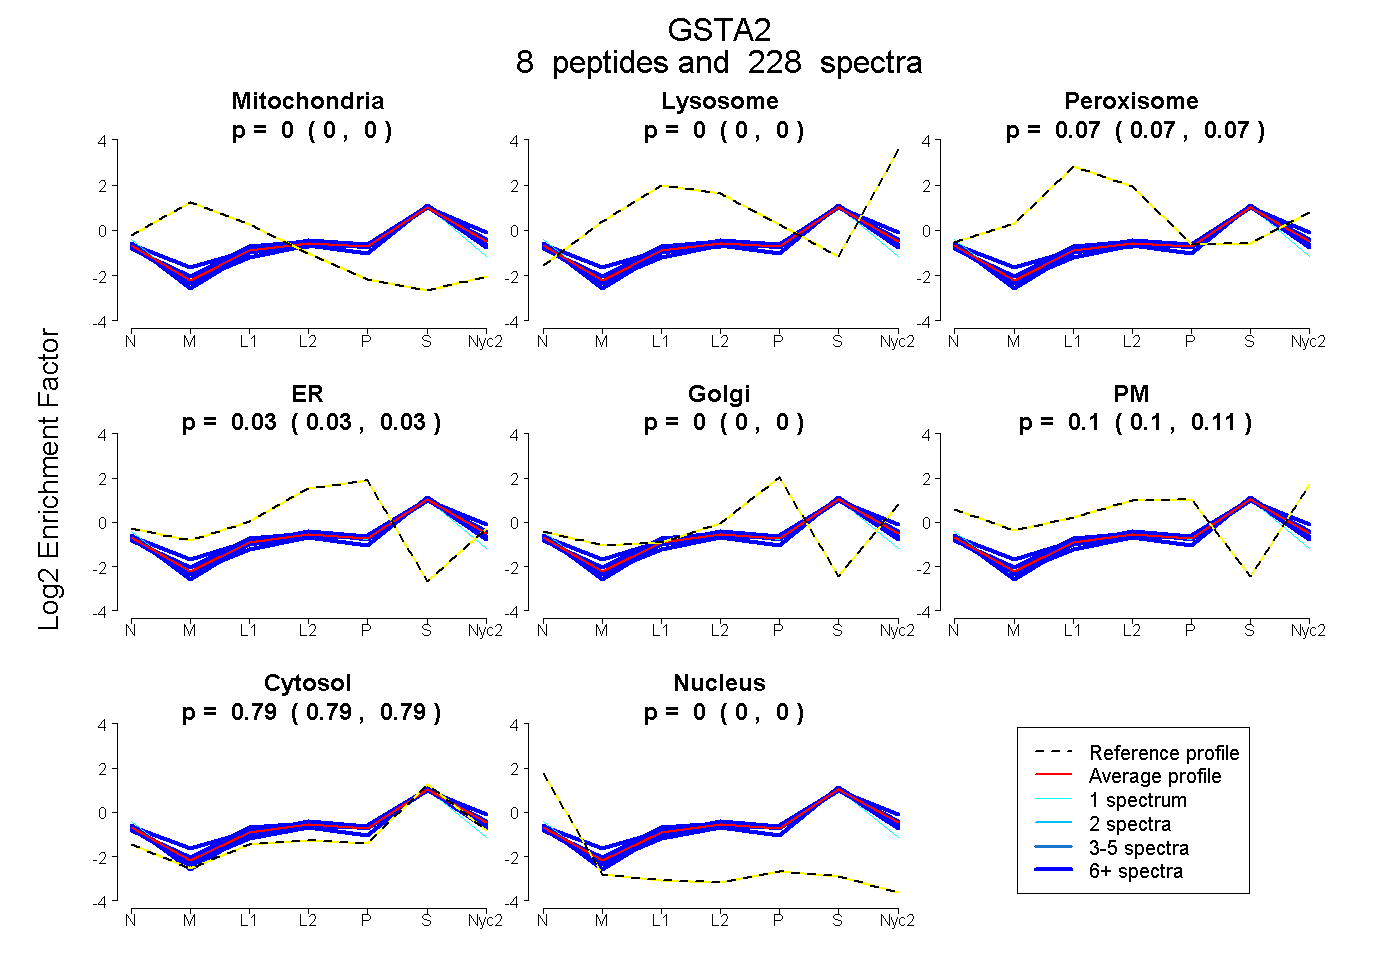
| Expt A |
8 peptides |
228 spectra |
|
0.000 0.000 | 0.000 |
0.000 0.000 | 0.000 |
0.072 0.071 | 0.074 |
0.031 0.027 | 0.034 |
0.000 0.000 | 0.000 |
0.103 0.098 | 0.106 |
0.794 0.792 | 0.795 |
0.000 0.000 | 0.000 |
| 27 spectra, LIQSPEDLEK | 0.000 | 0.000 | 0.071 | 0.011 | 0.000 | 0.117 | 0.802 | 0.000 | ||
| 29 spectra, DGNLMFDQVPMVEIDGMK | 0.000 | 0.039 | 0.091 | 0.000 | 0.000 | 0.119 | 0.751 | 0.000 | ||
| 1 spectrum, QLEEQVK | 0.000 | 0.000 | 0.059 | 0.116 | 0.000 | 0.000 | 0.784 | 0.040 | ||
| 16 spectra, WLLAAAGVEFEEK | 0.000 | 0.000 | 0.037 | 0.005 | 0.000 | 0.093 | 0.865 | 0.000 | ||
| 14 spectra, KPAMDAK | 0.000 | 0.000 | 0.037 | 0.129 | 0.000 | 0.016 | 0.818 | 0.000 | ||
| 51 spectra, SGKPVLHYFNAR | 0.000 | 0.000 | 0.037 | 0.123 | 0.000 | 0.031 | 0.809 | 0.000 | ||
| 44 spectra, YLPAFEK | 0.000 | 0.000 | 0.079 | 0.001 | 0.000 | 0.128 | 0.793 | 0.000 | ||
| 46 spectra, ISSLPNVK | 0.000 | 0.000 | 0.118 | 0.000 | 0.000 | 0.135 | 0.747 | 0.000 |
| Plot | Mito | Lyso or Perox | ER | Golgi | PM | Cytosol | Nucleus | ||||||
| Expt B |
10 peptides |
199 spectra |
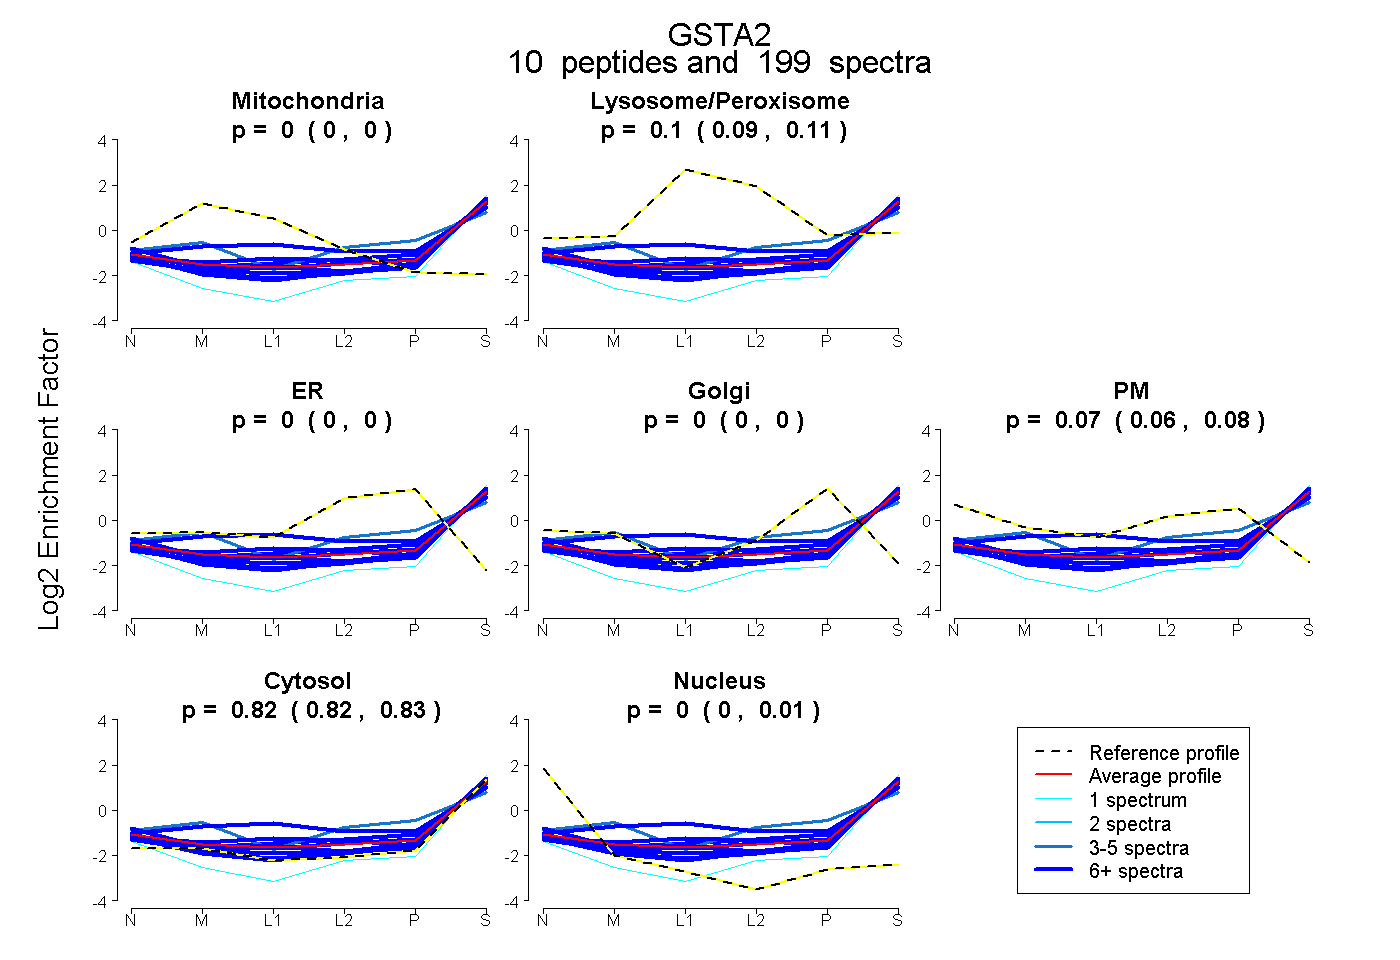 |
0.000 0.000 | 0.000 |
0.100 0.094 | 0.105 |
0.000 0.000 | 0.000 |
0.000 0.000 | 0.000 |
0.072 0.064 | 0.078 |
0.824 0.821 | 0.826 |
0.004 0.000 | 0.008 |
|||
| Plot | Lyso | Other | |||||||||||
| Expt C |
7 peptides |
295 spectra |
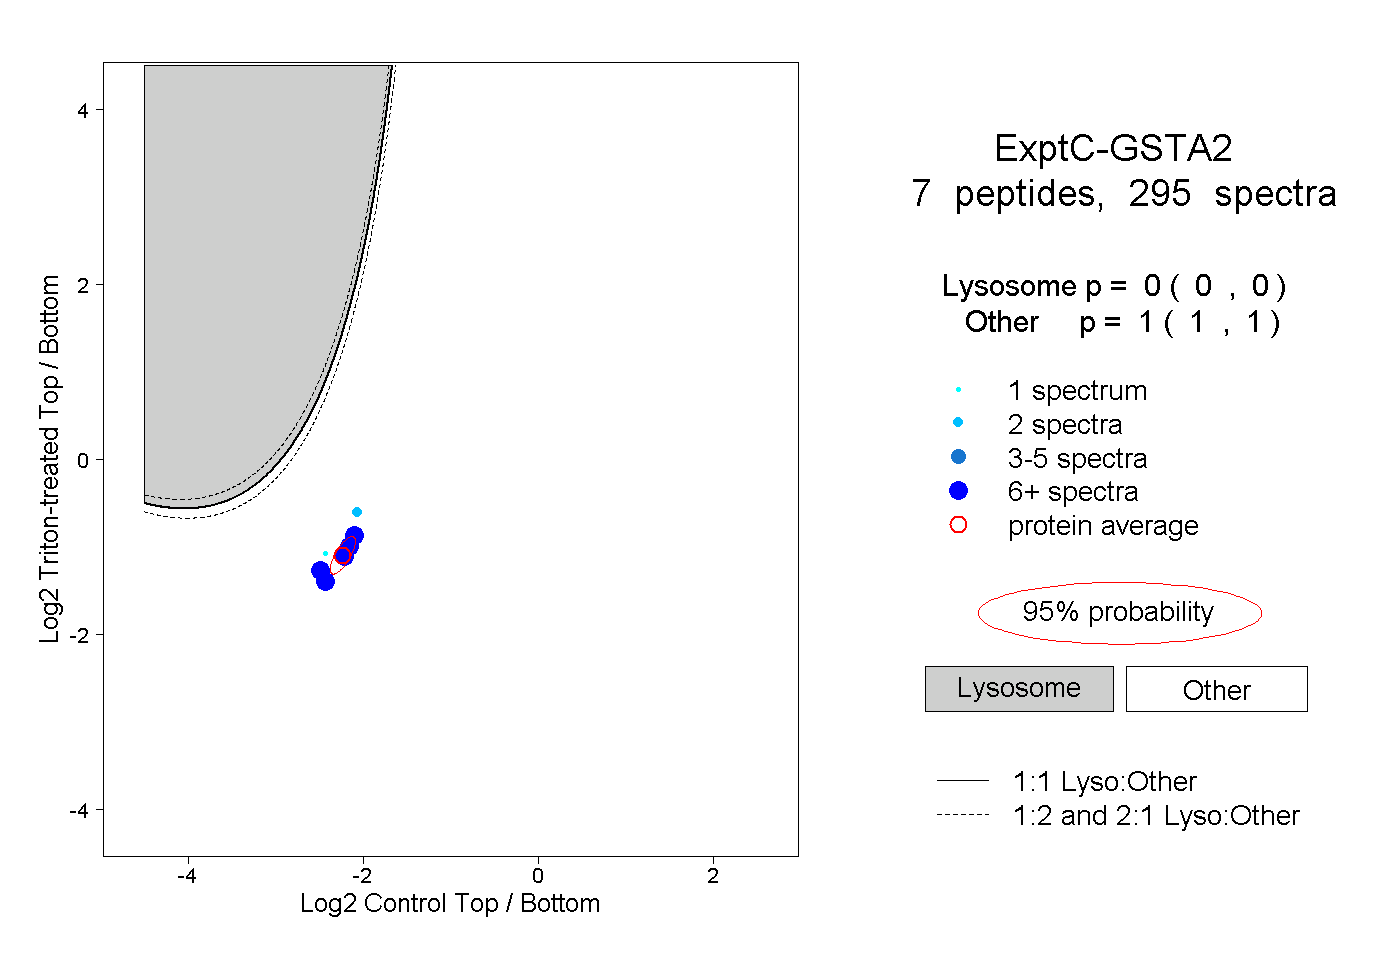 |
0.000 0.000 | 0.000 |
1.000 1.000 | 1.000 |
||||||||
| Plot | Lyso | Other | |||||||||||
| Expt D |
7 peptides |
27 spectra |
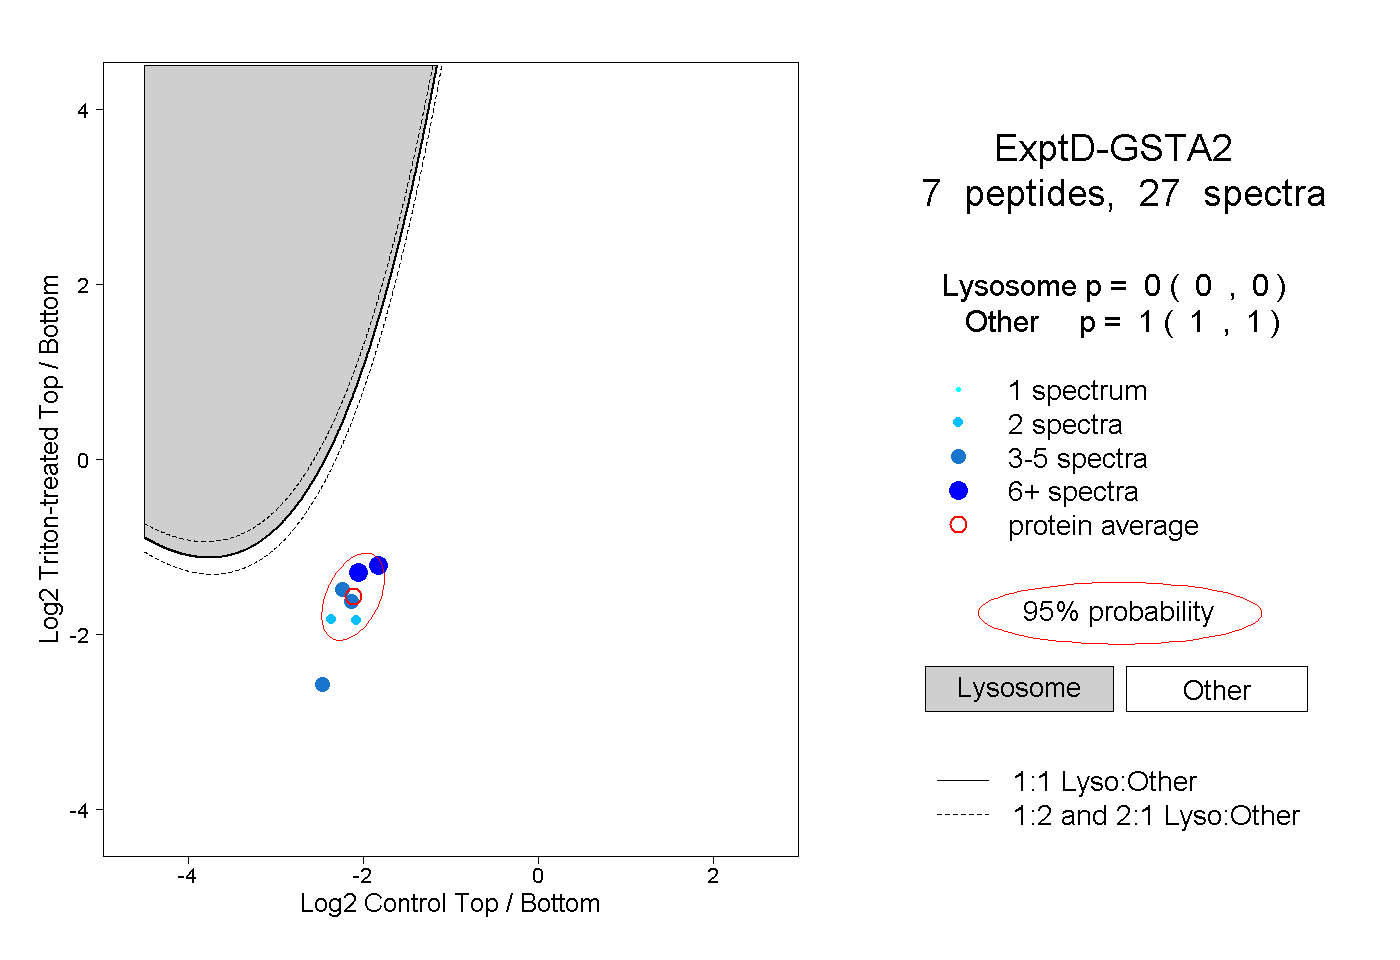 |
0.000 0.000 | 0.000 |
1.000 1.000 | 1.000 |