 24
24peptides
spectra
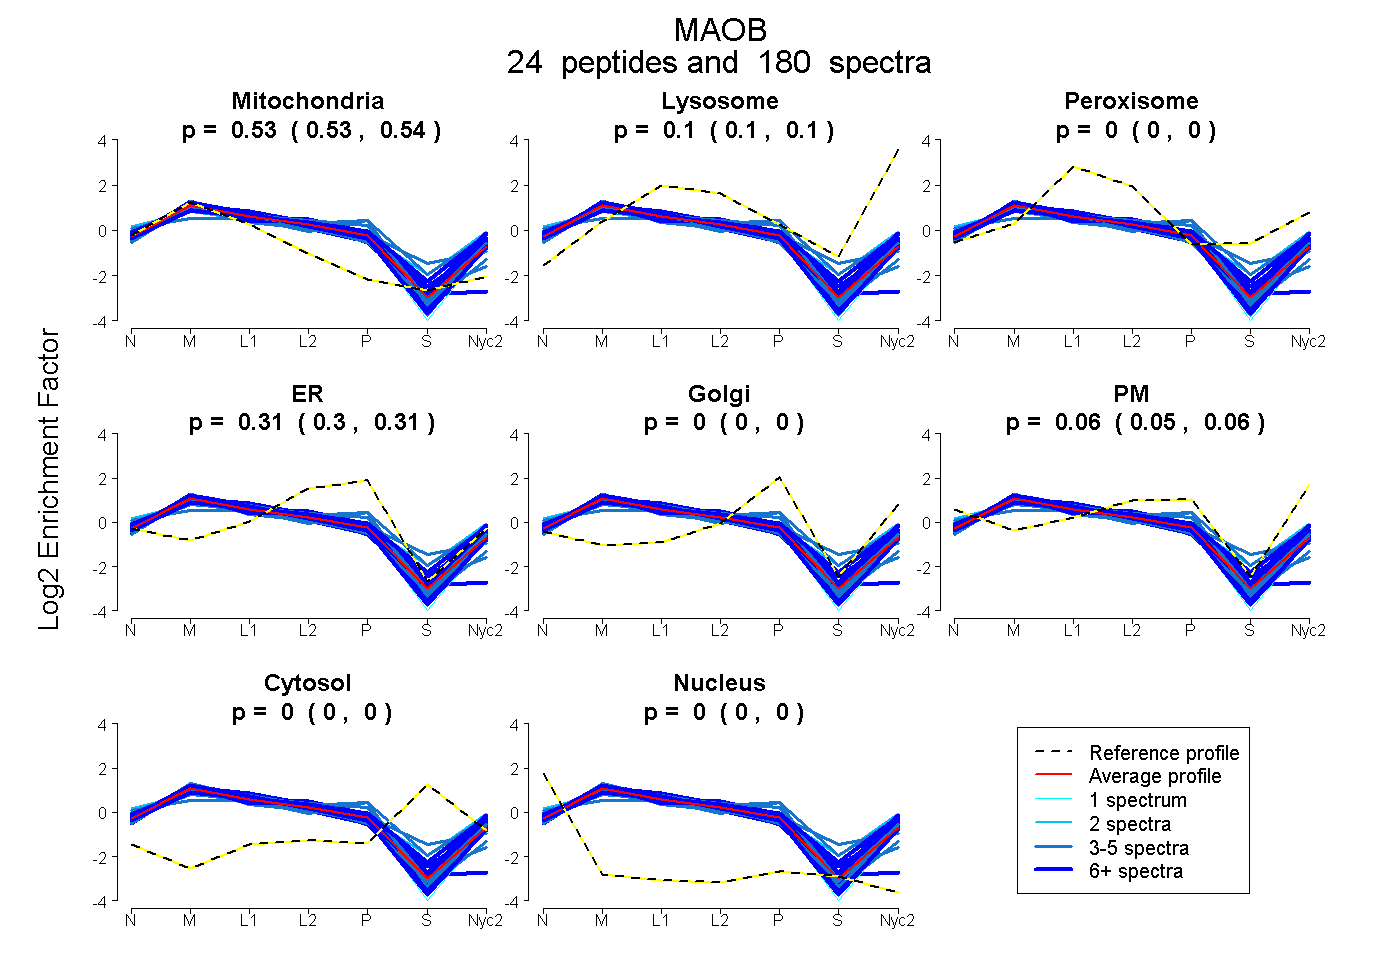
0.532 | 0.535
0.100 | 0.104
0.000 | 0.000
0.301 | 0.309
0.000 | 0.000
0.053 | 0.063
0.000 | 0.000
0.000 | 0.000
18peptides
spectra
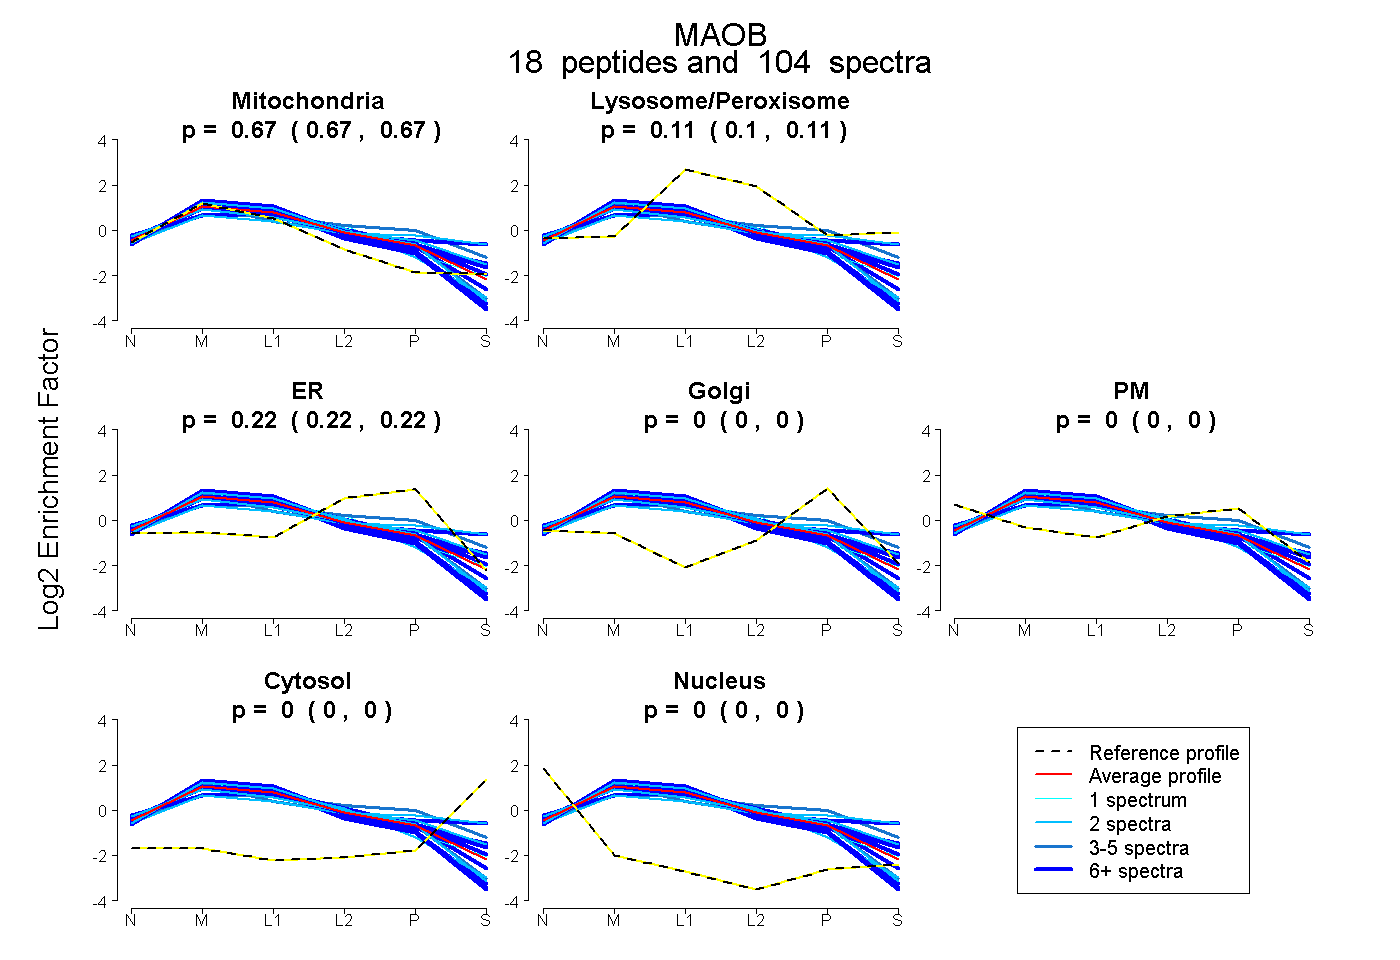
0.666 | 0.673
0.103 | 0.114
0.217 | 0.225
0.000 | 0.000
0.000 | 0.000
0.000 | 0.000
0.000 | 0.000
22peptides
spectra
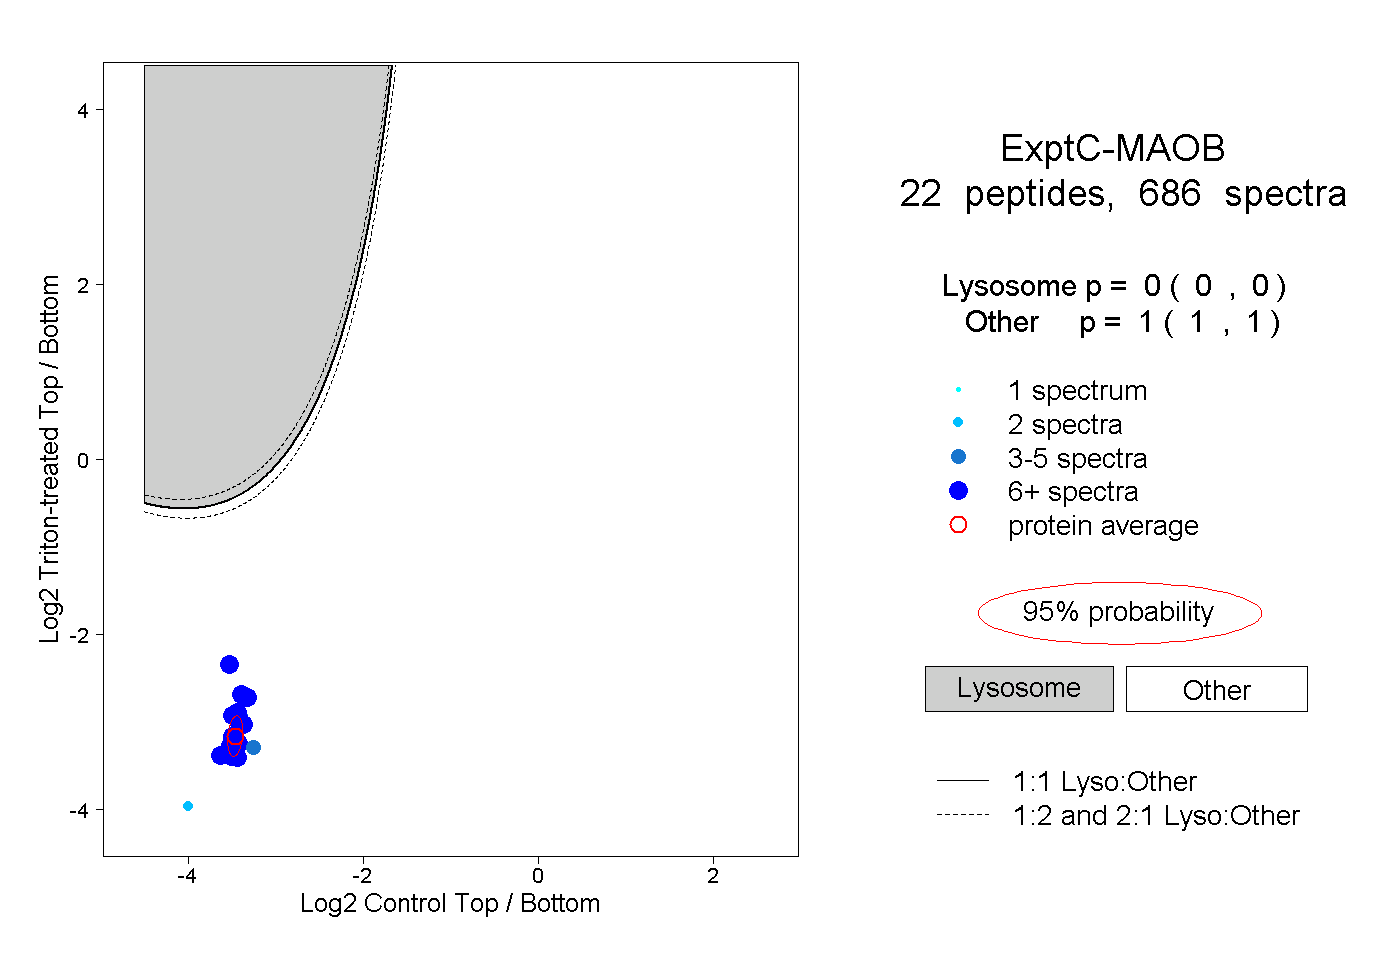
0.000 | 0.000
1.000 | 1.000
14peptides
spectra
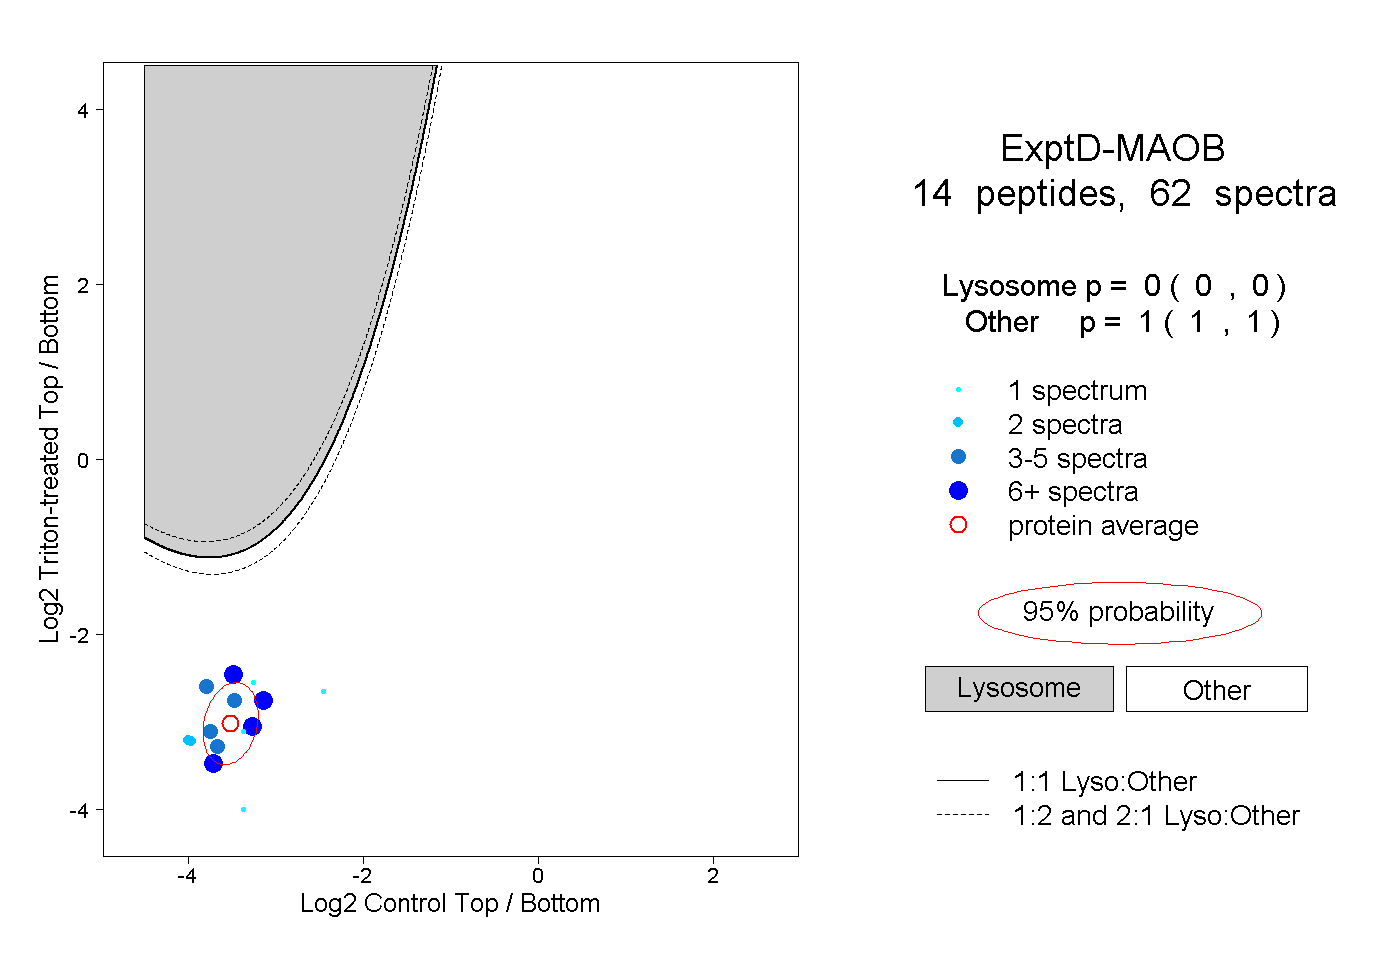
0.000 | 0.000
1.000 | 1.000