 9
9peptides
spectra
0.000 | 0.000
0.000 | 0.000
0.148 | 0.166
0.295 | 0.314
0.000 | 0.000
0.000 | 0.000
0.197 | 0.213
0.324 | 0.338
3peptides
spectra
0.000 | 0.000
1.000 | 1.000
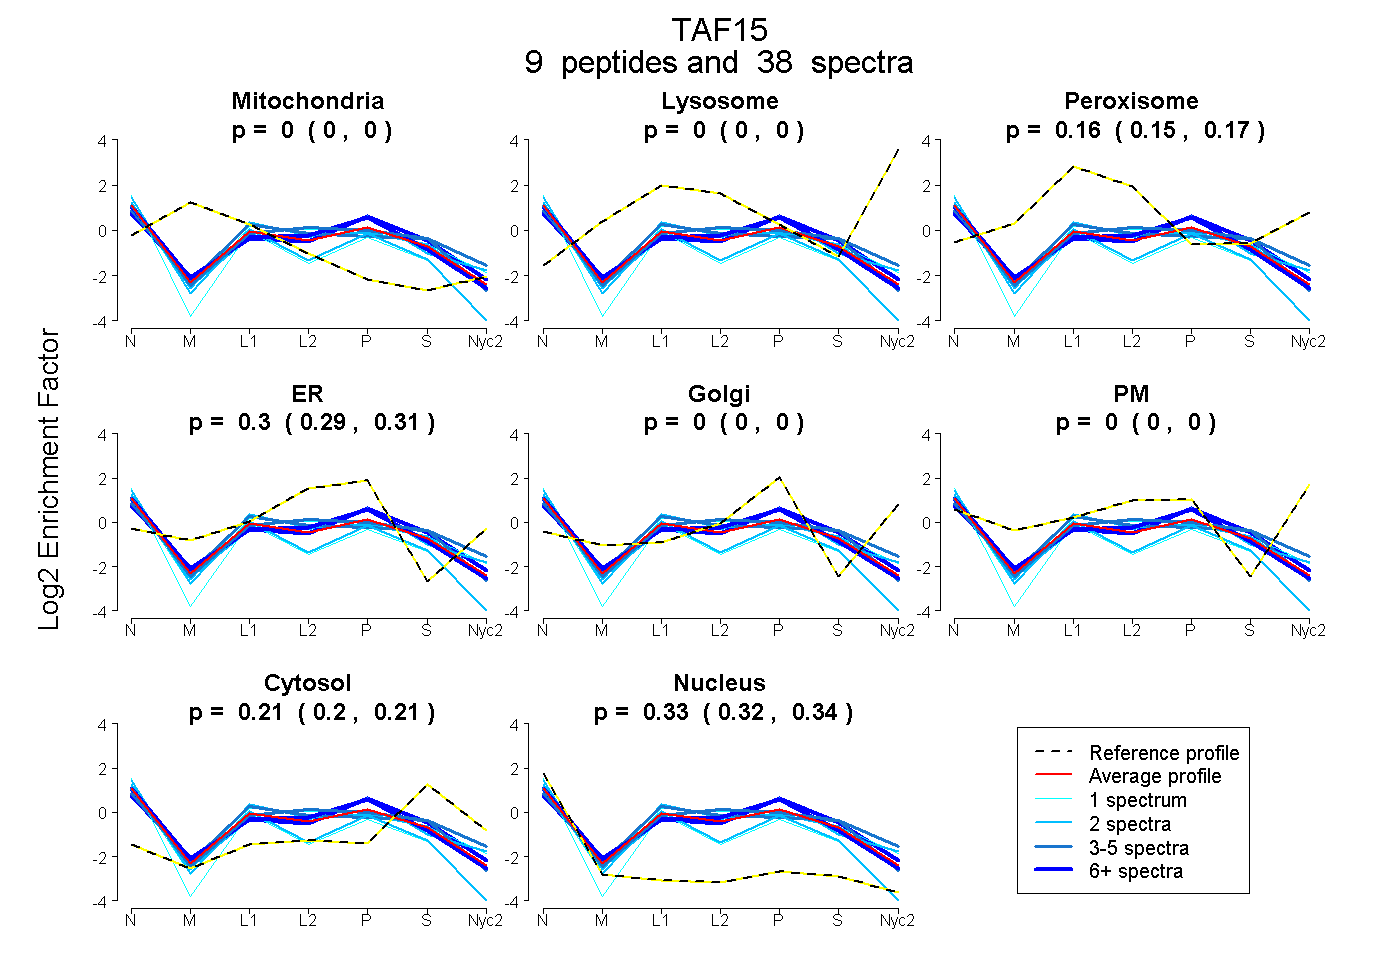
| Plot | Mito | Lyso | Perox | ER | Golgi | PM | Cytosol | Nucleus | |||||
| Expt A |
9 peptides |
38 spectra |
|
0.000 0.000 | 0.000 |
0.000 0.000 | 0.000 |
0.158 0.148 | 0.166 |
0.305 0.295 | 0.314 |
0.000 0.000 | 0.000 |
0.000 0.000 | 0.000 |
0.205 0.197 | 0.213 |
0.332 0.324 | 0.338 |
||
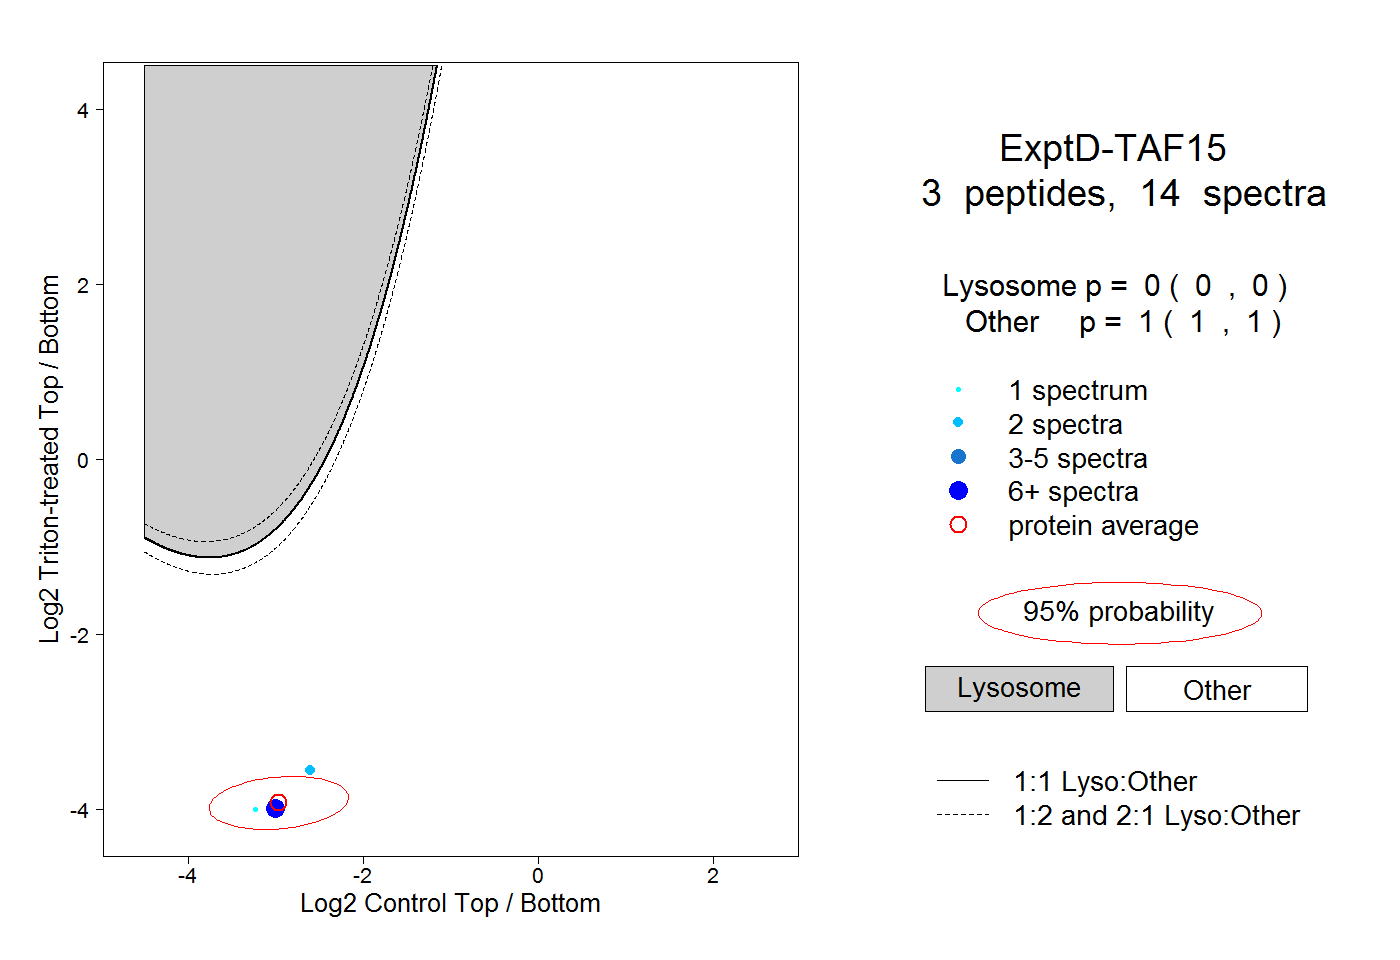
| Plot | Lyso | Other | |||||||||||
| Expt D |
3 peptides |
14 spectra |
|
0.000 0.000 | 0.000 |
1.000 1.000 | 1.000 |