 10
10peptides
spectra
0.000 | 0.000
0.000 | 0.000
0.000 | 0.000
0.000 | 0.000
0.000 | 0.000
0.000 | 0.000
1.000 | 1.000
0.000 | 0.000
| Plot | Mito | Lyso | Perox | ER | Golgi | PM | Cytosol | Nucleus | |||||
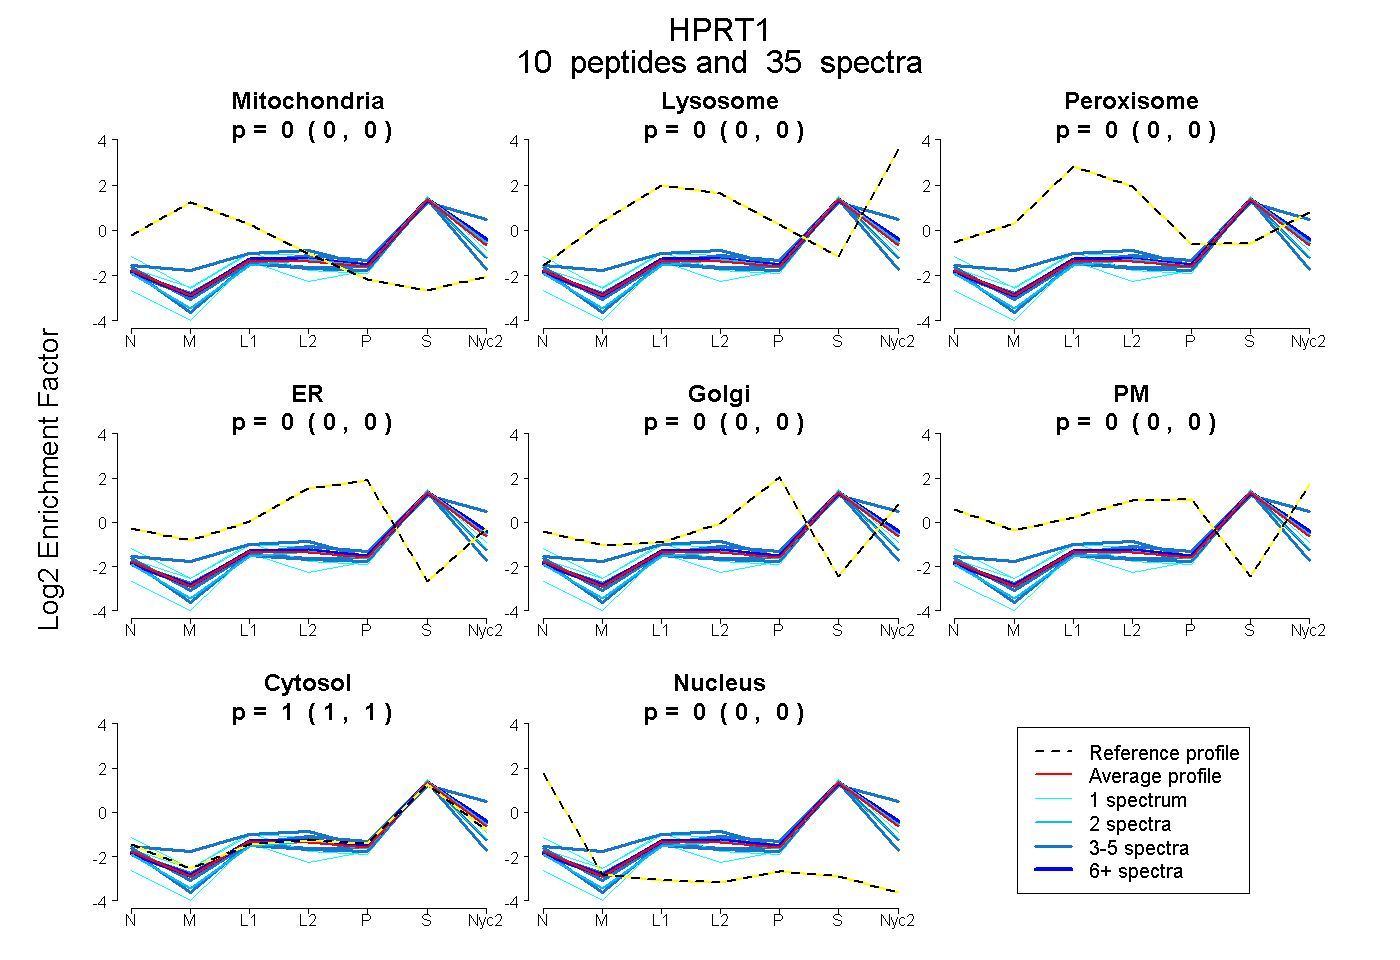
| Expt A |
10 peptides |
35 spectra |
|
0.000 0.000 | 0.000 |
0.000 0.000 | 0.000 |
0.000 0.000 | 0.000 |
0.000 0.000 | 0.000 |
0.000 0.000 | 0.000 |
0.000 0.000 | 0.000 |
1.000 1.000 | 1.000 |
0.000 0.000 | 0.000 |
| 1 spectrum, FVVGYALDYNEHFR | 0.000 | 0.000 | 0.000 | 0.000 | 0.000 | 0.000 | 1.000 | 0.000 | ||
| 3 spectra, FFADLLDYIK | 0.000 | 0.015 | 0.000 | 0.000 | 0.000 | 0.000 | 0.985 | 0.000 | ||
| 10 spectra, VFIPHGLIMDR | 0.000 | 0.018 | 0.000 | 0.000 | 0.000 | 0.000 | 0.982 | 0.000 | ||
| 1 spectrum, EMGGHHIVALCVLK | 0.000 | 0.000 | 0.051 | 0.000 | 0.000 | 0.000 | 0.924 | 0.025 | ||
| 4 spectra, DLNHVCVISESGK | 0.000 | 0.000 | 0.000 | 0.000 | 0.000 | 0.000 | 0.987 | 0.013 | ||
| 5 spectra, TMQTLLSLVK | 0.000 | 0.186 | 0.000 | 0.000 | 0.000 | 0.000 | 0.814 | 0.000 | ||
| 2 spectra, VIGGDDLSTLTGK | 0.000 | 0.000 | 0.000 | 0.000 | 0.000 | 0.000 | 1.000 | 0.000 | ||
| 1 spectrum, NVLIVEDIIDTGK | 0.000 | 0.022 | 0.000 | 0.000 | 0.000 | 0.000 | 0.978 | 0.000 | ||
| 5 spectra, SIPMTVDFIR | 0.000 | 0.000 | 0.000 | 0.000 | 0.000 | 0.000 | 1.000 | 0.000 | ||
| 3 spectra, SYCNDQSTGDIK | 0.000 | 0.000 | 0.000 | 0.000 | 0.000 | 0.000 | 0.974 | 0.026 |
| Plot | Mito | Lyso or Perox | ER | Golgi | PM | Cytosol | Nucleus | ||||||
| Expt B |
6 peptides |
31 spectra |
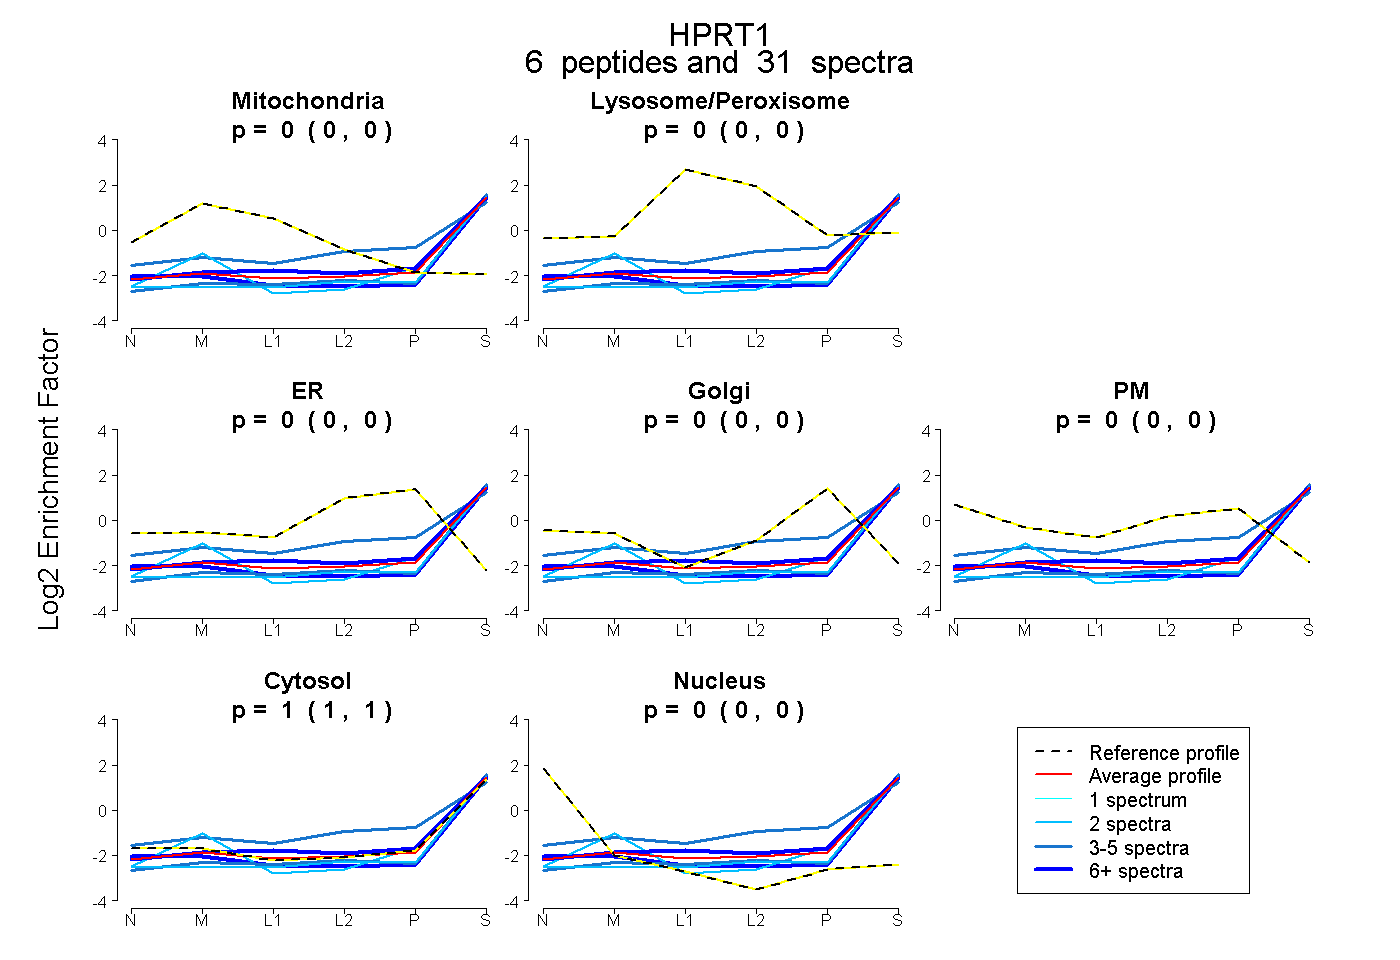 |
0.000 0.000 | 0.000 |
0.000 0.000 | 0.000 |
0.000 0.000 | 0.000 |
0.000 0.000 | 0.000 |
0.000 0.000 | 0.000 |
1.000 1.000 | 1.000 |
0.000 0.000 | 0.000 |
|||
| Plot | Lyso | Other | |||||||||||
| Expt C |
9 peptides |
49 spectra |
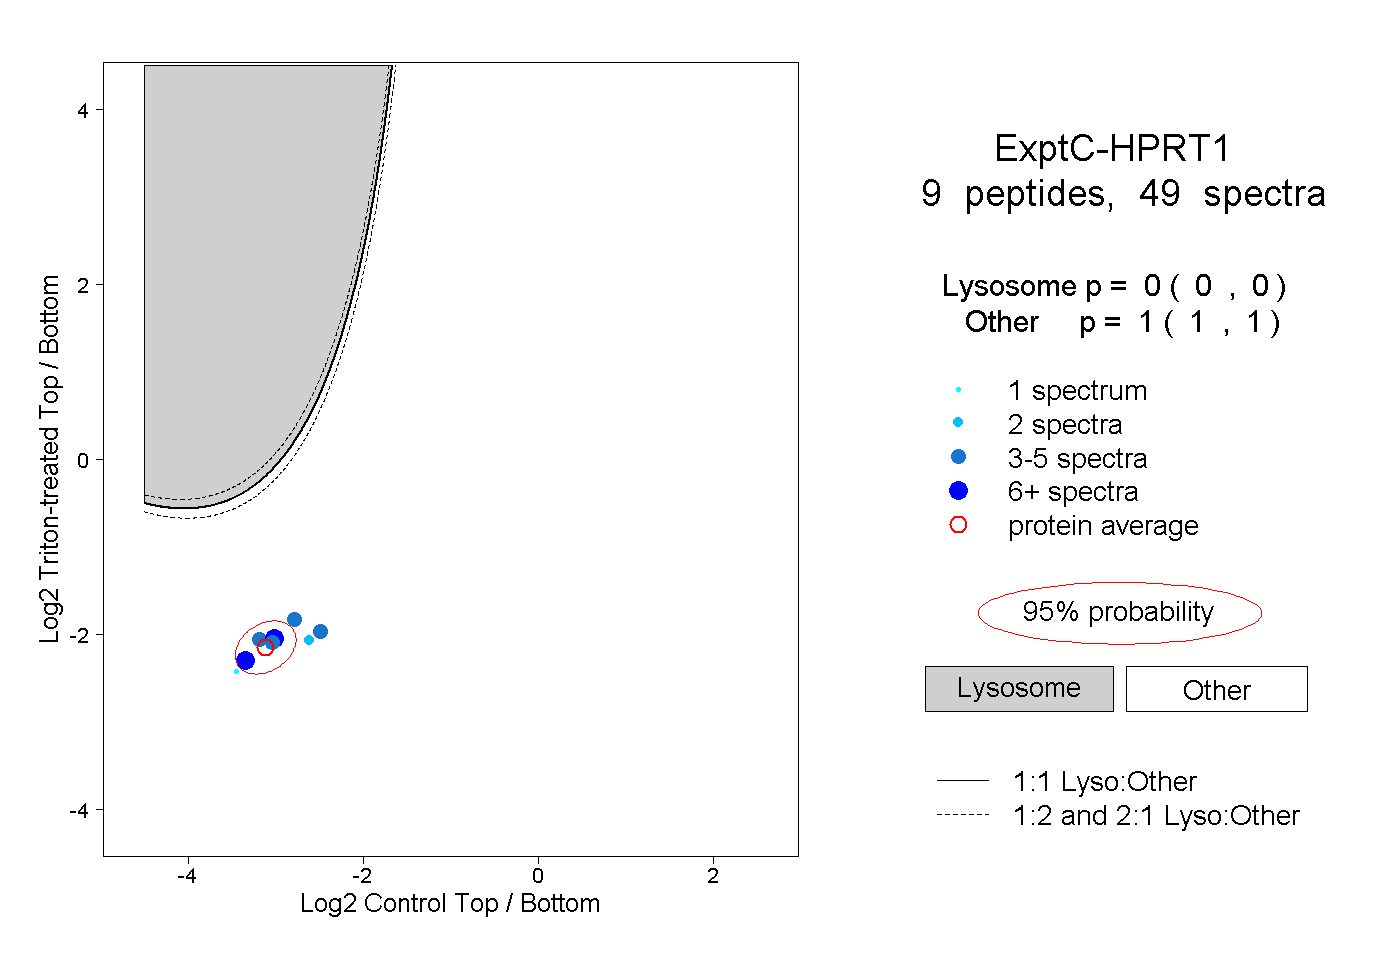 |
0.000 0.000 | 0.000 |
1.000 1.000 | 1.000 |
||||||||
| Plot | Lyso | Other | |||||||||||
| Expt D |
1 peptide |
1 spectrum |
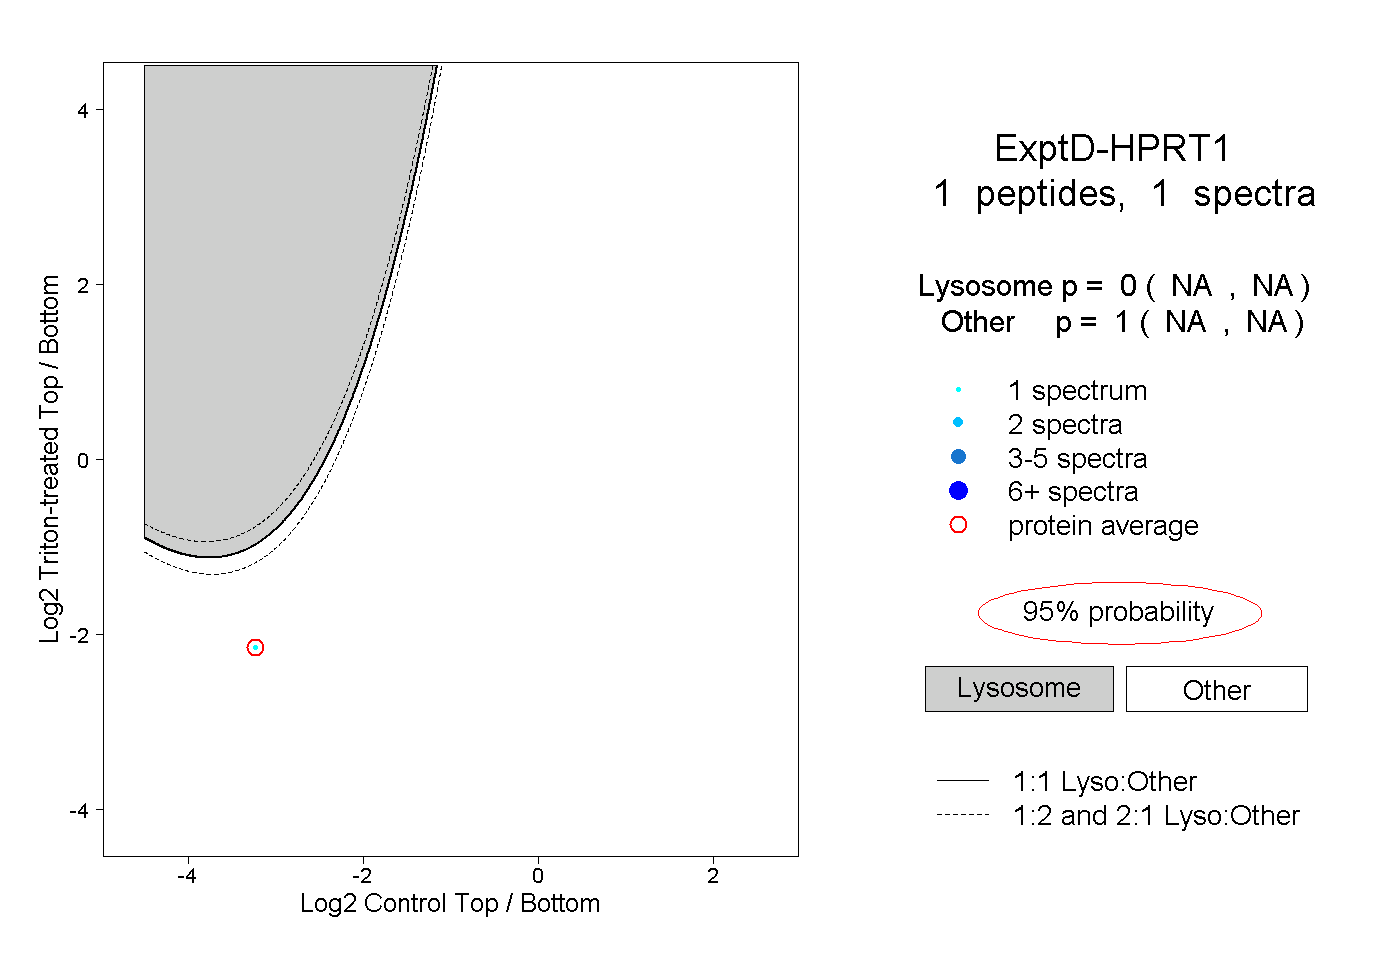 |
0.000 NA | NA |
1.000 NA | NA |