 7
7peptides
spectra
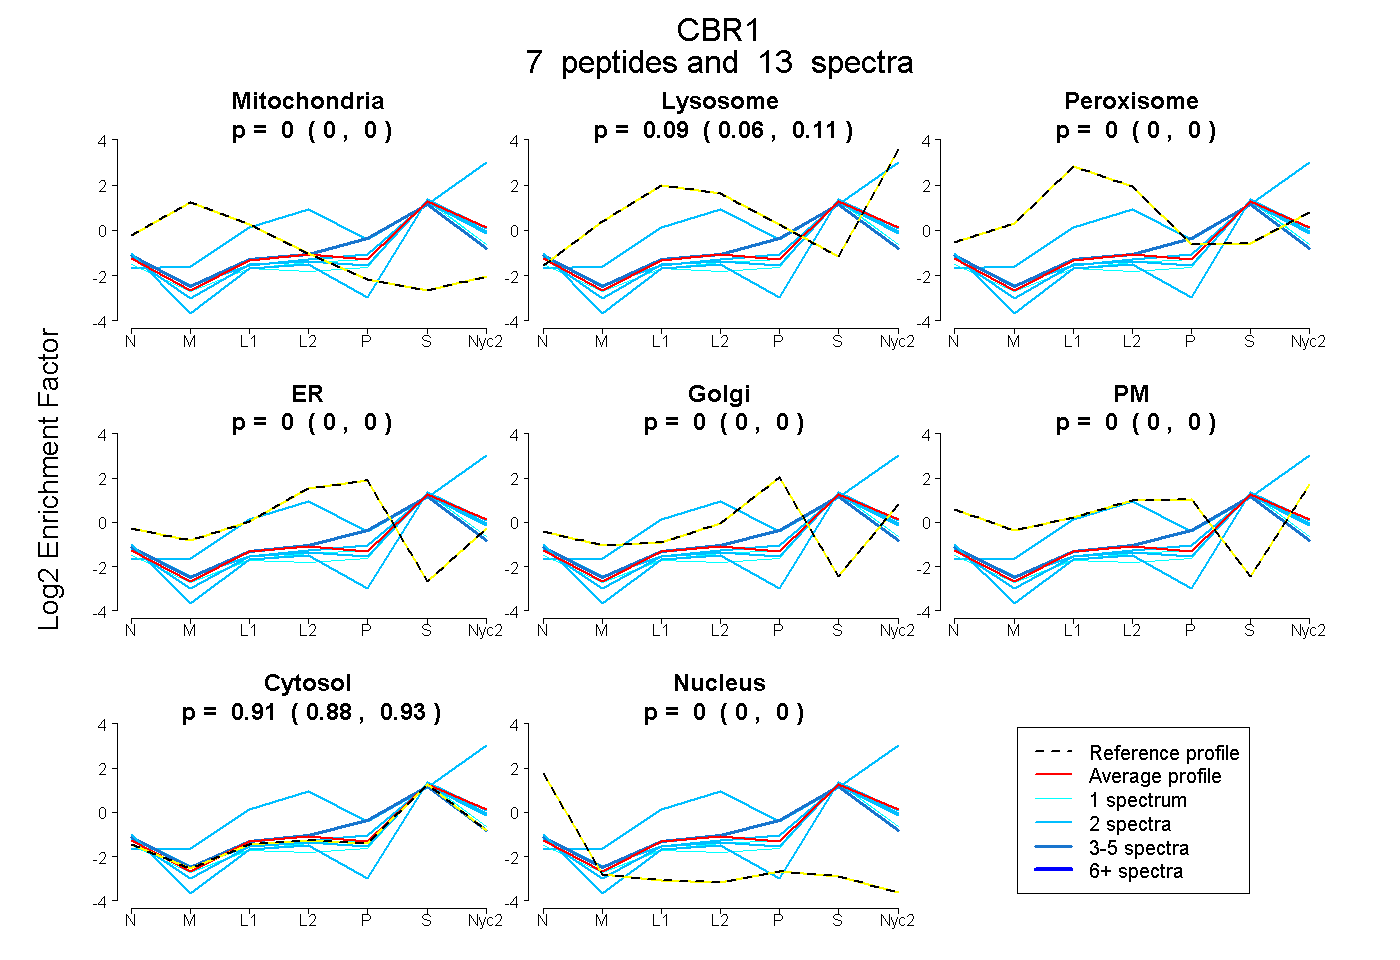
0.000 | 0.000
0.062 | 0.110
0.000 | 0.000
0.000 | 0.000
0.000 | 0.000
0.000 | 0.000
0.885 | 0.934
0.000 | 0.000
5peptides
spectra
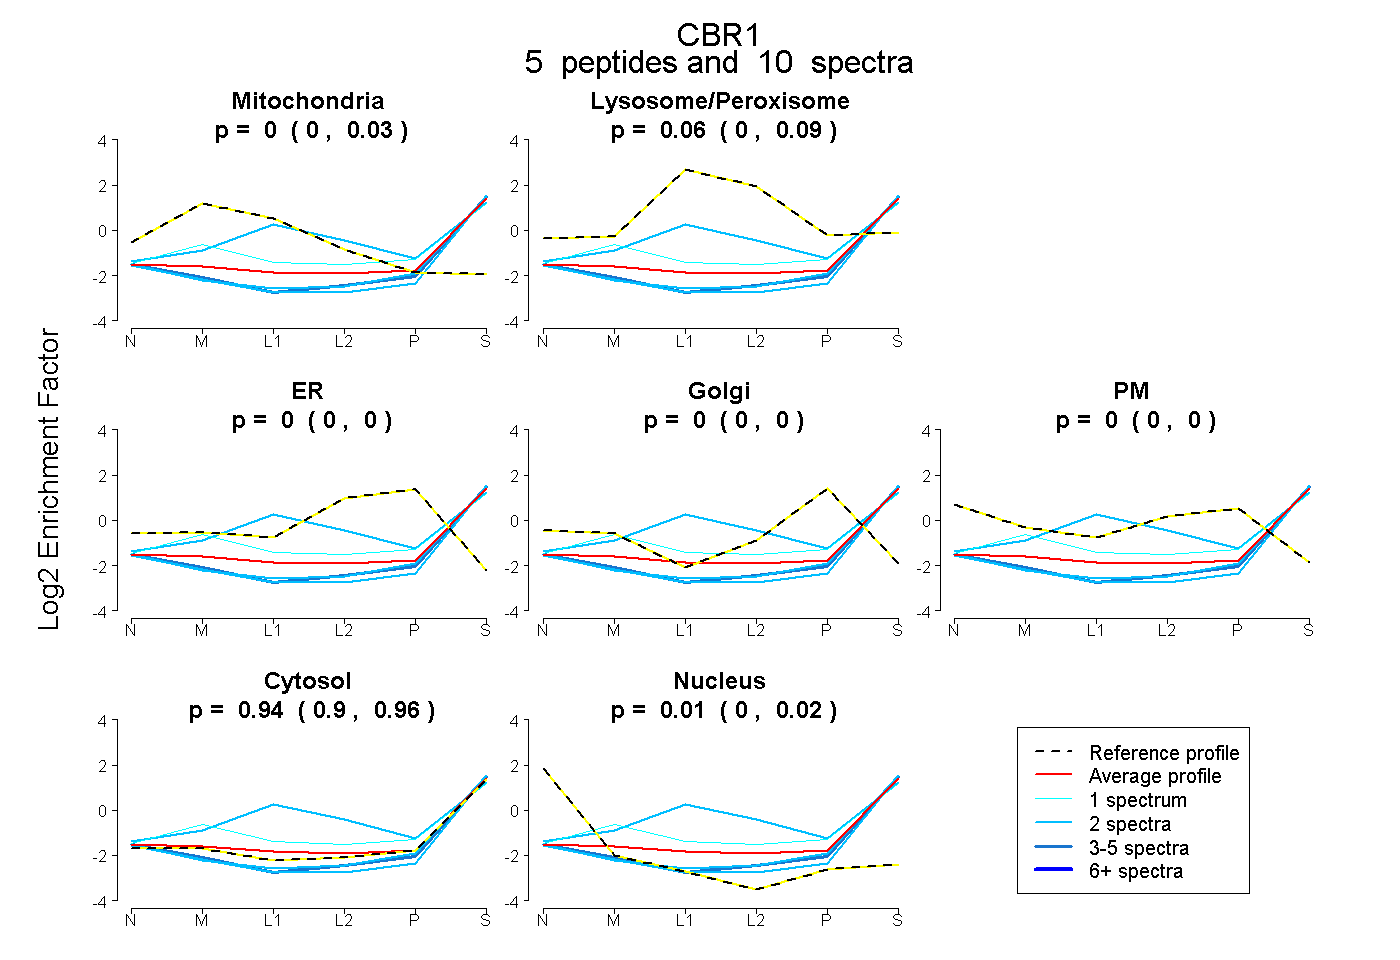
0.000 | 0.029
0.002 | 0.094
0.000 | 0.000
0.000 | 0.000
0.000 | 0.004
0.897 | 0.963
0.000 | 0.019
9peptides
spectra
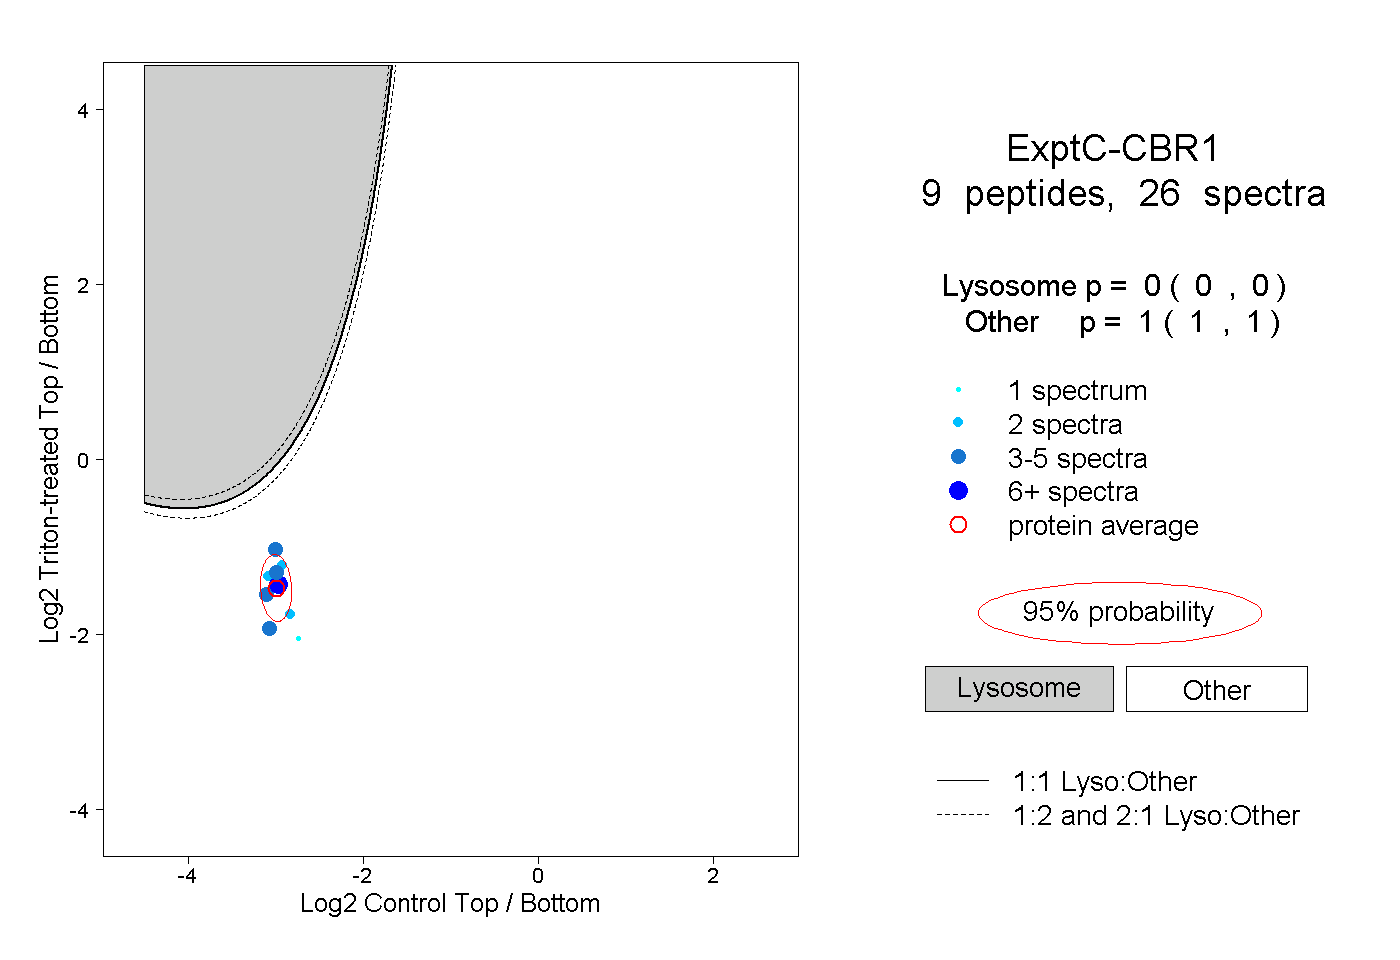
0.000 | 0.000
1.000 | 1.000
1peptide
spectrum
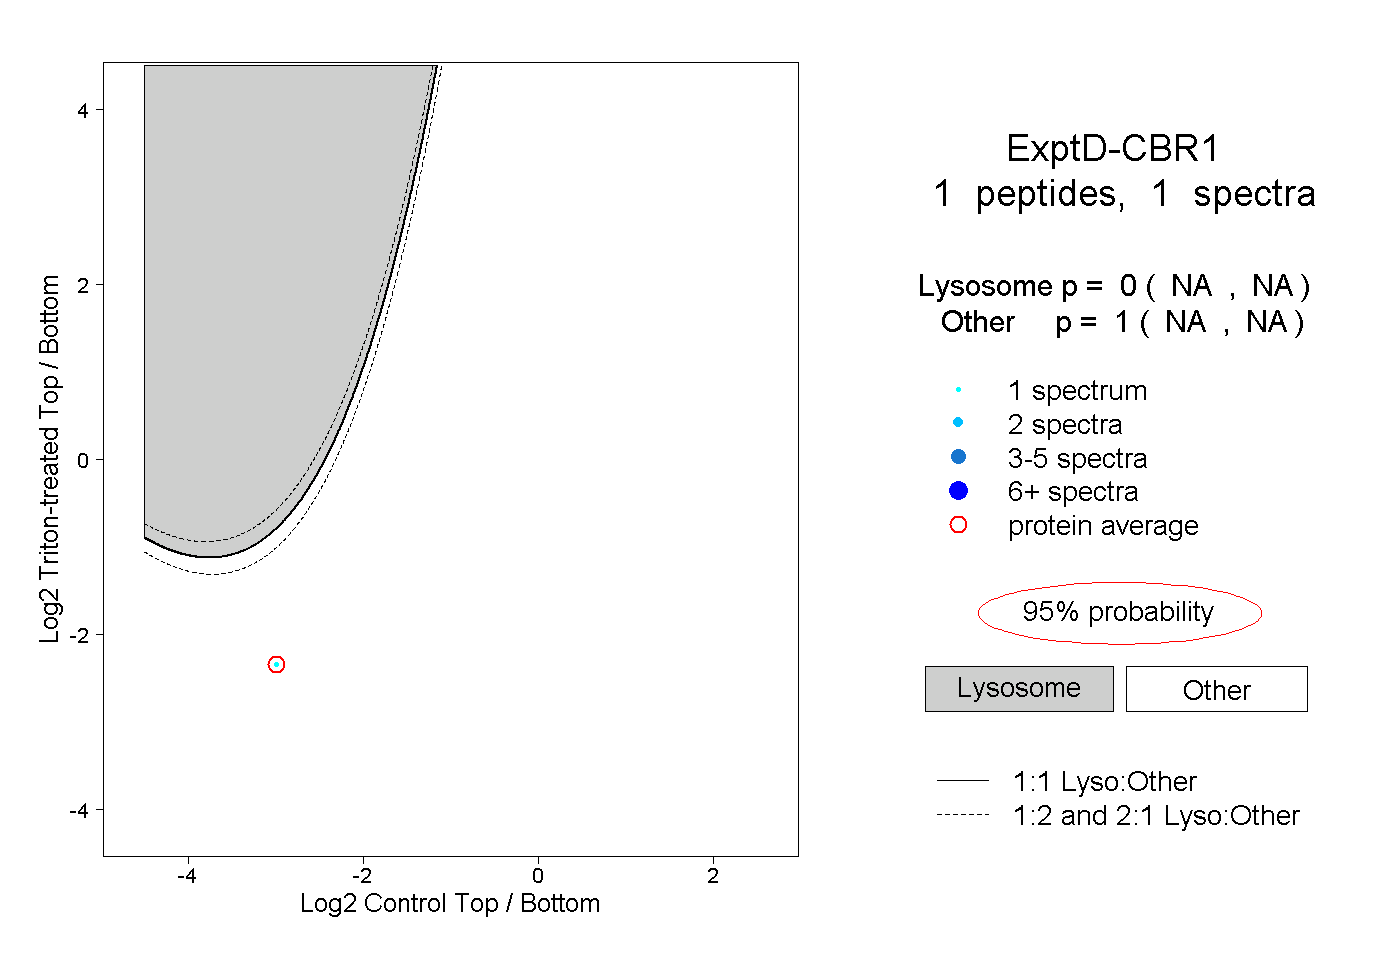
NA | NA
NA | NA