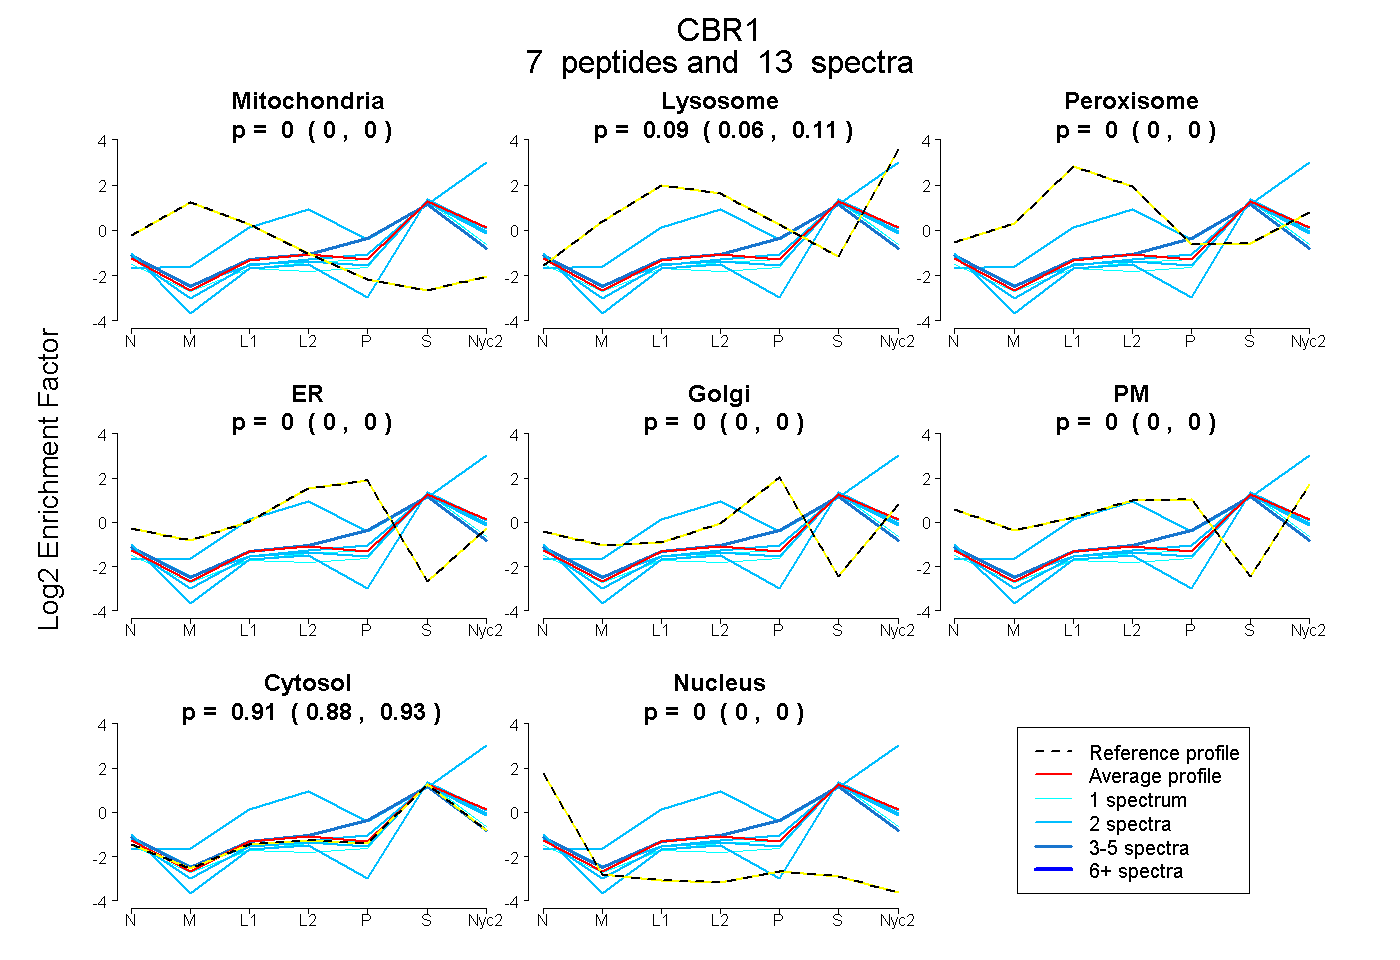
 7
7peptides
spectra
0.000 | 0.000
0.062 | 0.110
0.000 | 0.000
0.000 | 0.000
0.000 | 0.000
0.000 | 0.000
0.885 | 0.934
0.000 | 0.000
| Plot | Mito | Lyso | Perox | ER | Golgi | PM | Cytosol | Nucleus | |||||
| Expt A |
7 peptides |
13 spectra |
|
0.000 0.000 | 0.000 |
0.088 0.062 | 0.110 |
0.000 0.000 | 0.000 |
0.000 0.000 | 0.000 |
0.000 0.000 | 0.000 |
0.000 0.000 | 0.000 |
0.912 0.885 | 0.934 |
0.000 0.000 | 0.000 |
| 2 spectra, SETITEEELVGLMNK | 0.000 | 0.000 | 0.000 | 0.000 | 0.000 | 0.000 | 0.967 | 0.033 | ||
| 2 spectra, QLQTEGLSPR | 0.000 | 0.022 | 0.000 | 0.000 | 0.000 | 0.000 | 0.978 | 0.000 | ||
| 2 spectra, FHQLDIDNPQSIR | 0.000 | 0.588 | 0.000 | 0.000 | 0.000 | 0.000 | 0.412 | 0.000 | ||
| 2 spectra, IGVTVLSR | 0.000 | 0.026 | 0.000 | 0.000 | 0.031 | 0.026 | 0.916 | 0.000 | ||
| 1 spectrum, ELLPIIKPQGR | 0.000 | 0.000 | 0.000 | 0.000 | 0.004 | 0.000 | 0.986 | 0.009 | ||
| 3 spectra, SCSPELQQK | 0.000 | 0.000 | 0.000 | 0.040 | 0.099 | 0.000 | 0.861 | 0.000 | ||
| 1 spectrum, FLGDVVLTAR | 0.000 | 0.000 | 0.000 | 0.000 | 0.000 | 0.000 | 0.986 | 0.014 |
| Plot | Mito | Lyso or Perox | ER | Golgi | PM | Cytosol | Nucleus | ||||||
| Expt B |
5 peptides |
10 spectra |
 |
0.000 0.000 | 0.029 |
0.059 0.002 | 0.094 |
0.000 0.000 | 0.000 |
0.000 0.000 | 0.000 |
0.000 0.000 | 0.004 |
0.936 0.897 | 0.963 |
0.006 0.000 | 0.019 |
|||
| Plot | Lyso | Other | |||||||||||
| Expt C |
9 peptides |
26 spectra |
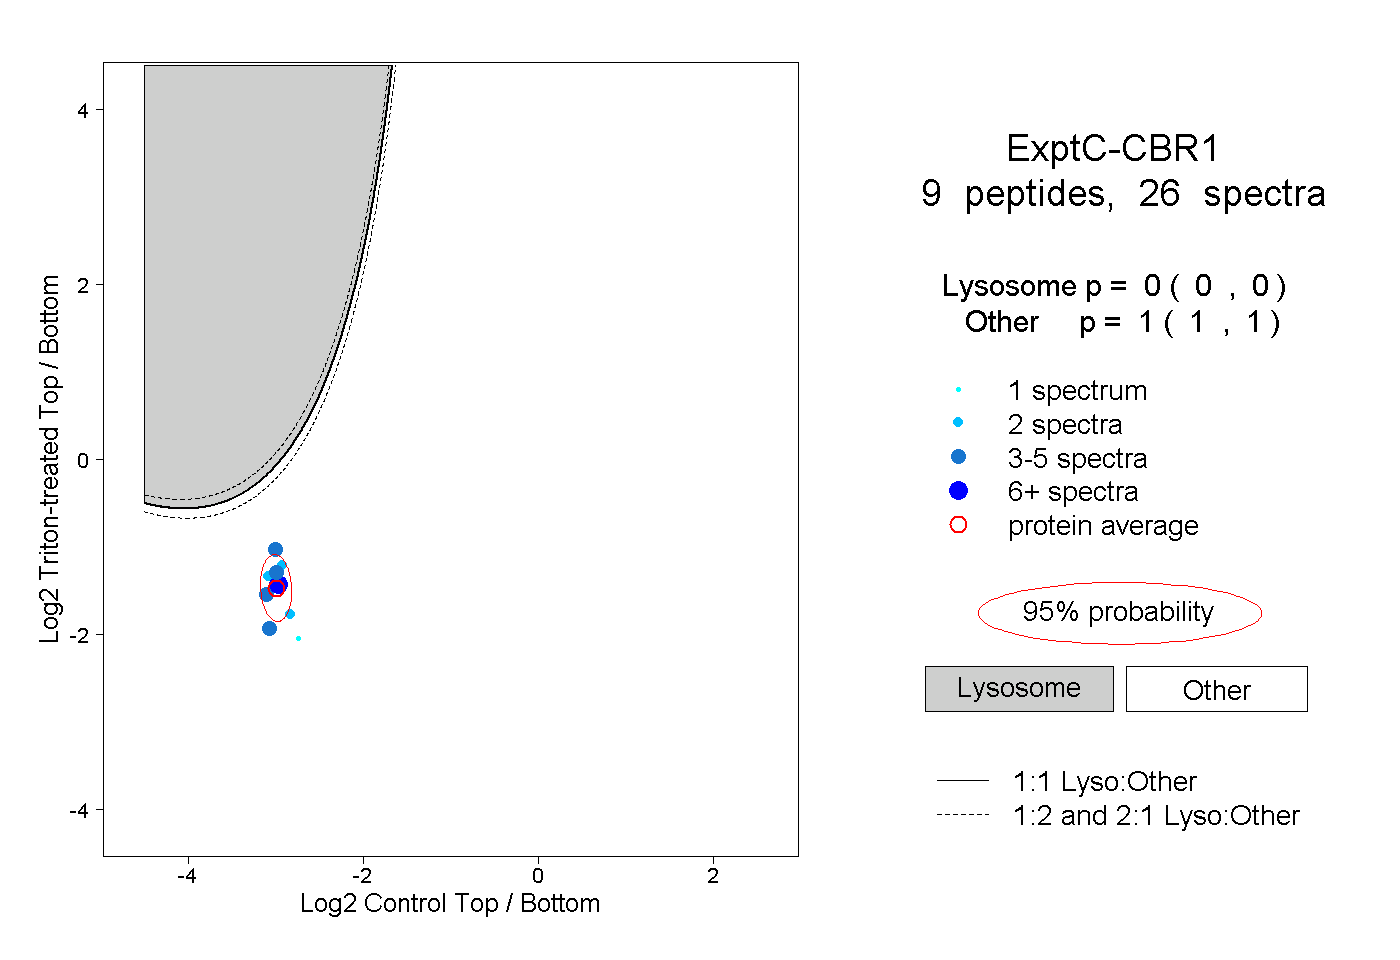 |
0.000 0.000 | 0.000 |
1.000 1.000 | 1.000 |
||||||||
| Plot | Lyso | Other | |||||||||||
| Expt D |
1 peptide |
1 spectrum |
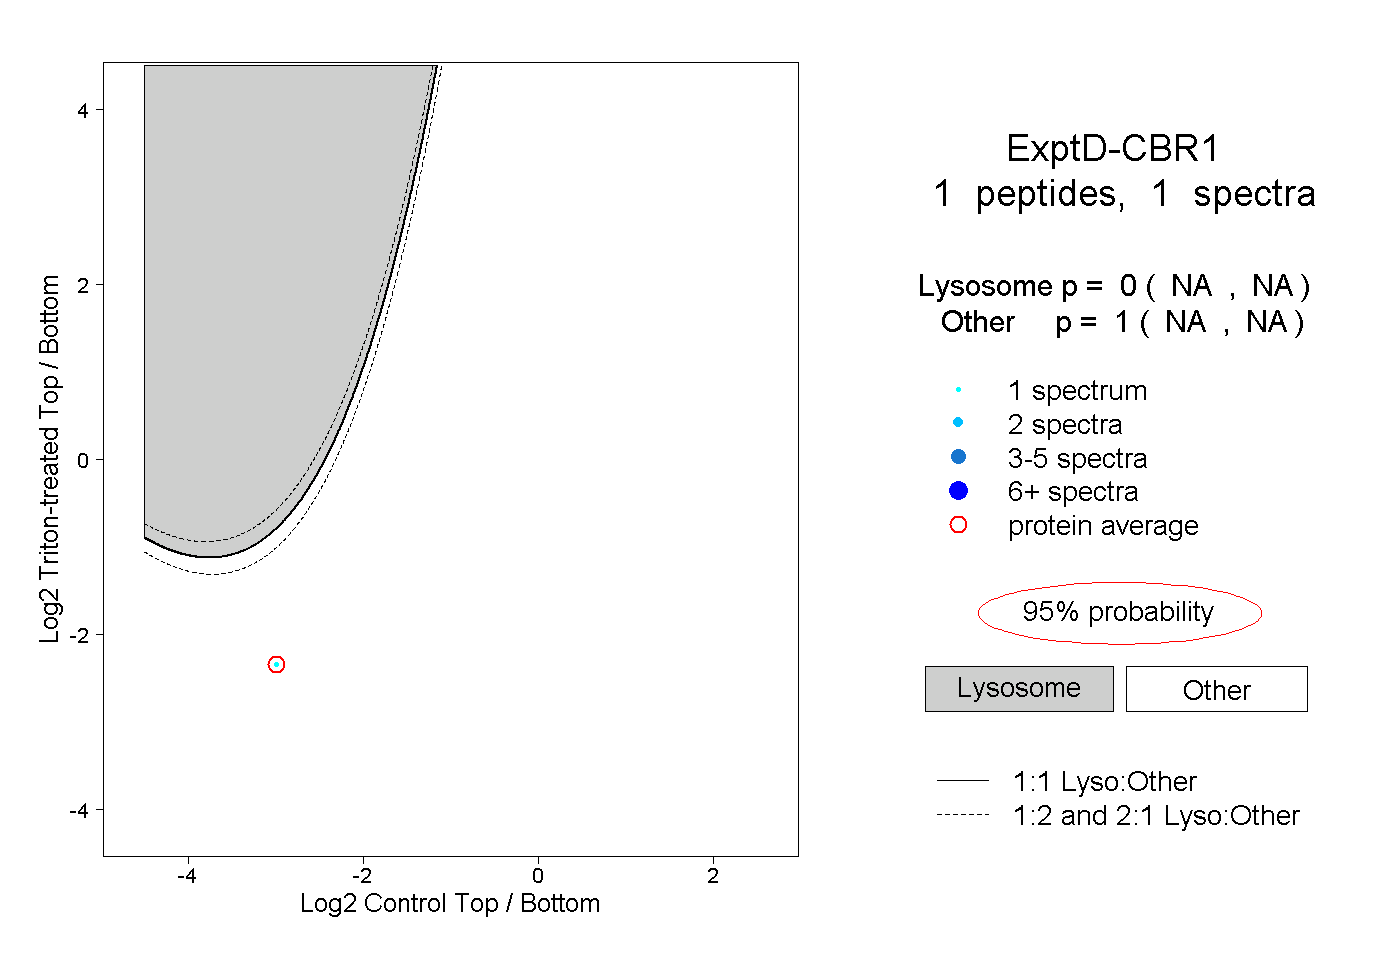 |
0.000 NA | NA |
1.000 NA | NA |