 2
2peptides
spectra
0.167 | 0.434
0.000 | 0.194
0.194 | 0.554
0.000 | 0.089
0.000 | 0.204
0.000 | 0.140
0.000 | 0.180
0.000 | 0.024
4peptides
spectra
0.000 | 0.002
0.998 | 1.000
| Plot | Mito | Lyso | Perox | ER | Golgi | PM | Cytosol | Nucleus | |||||
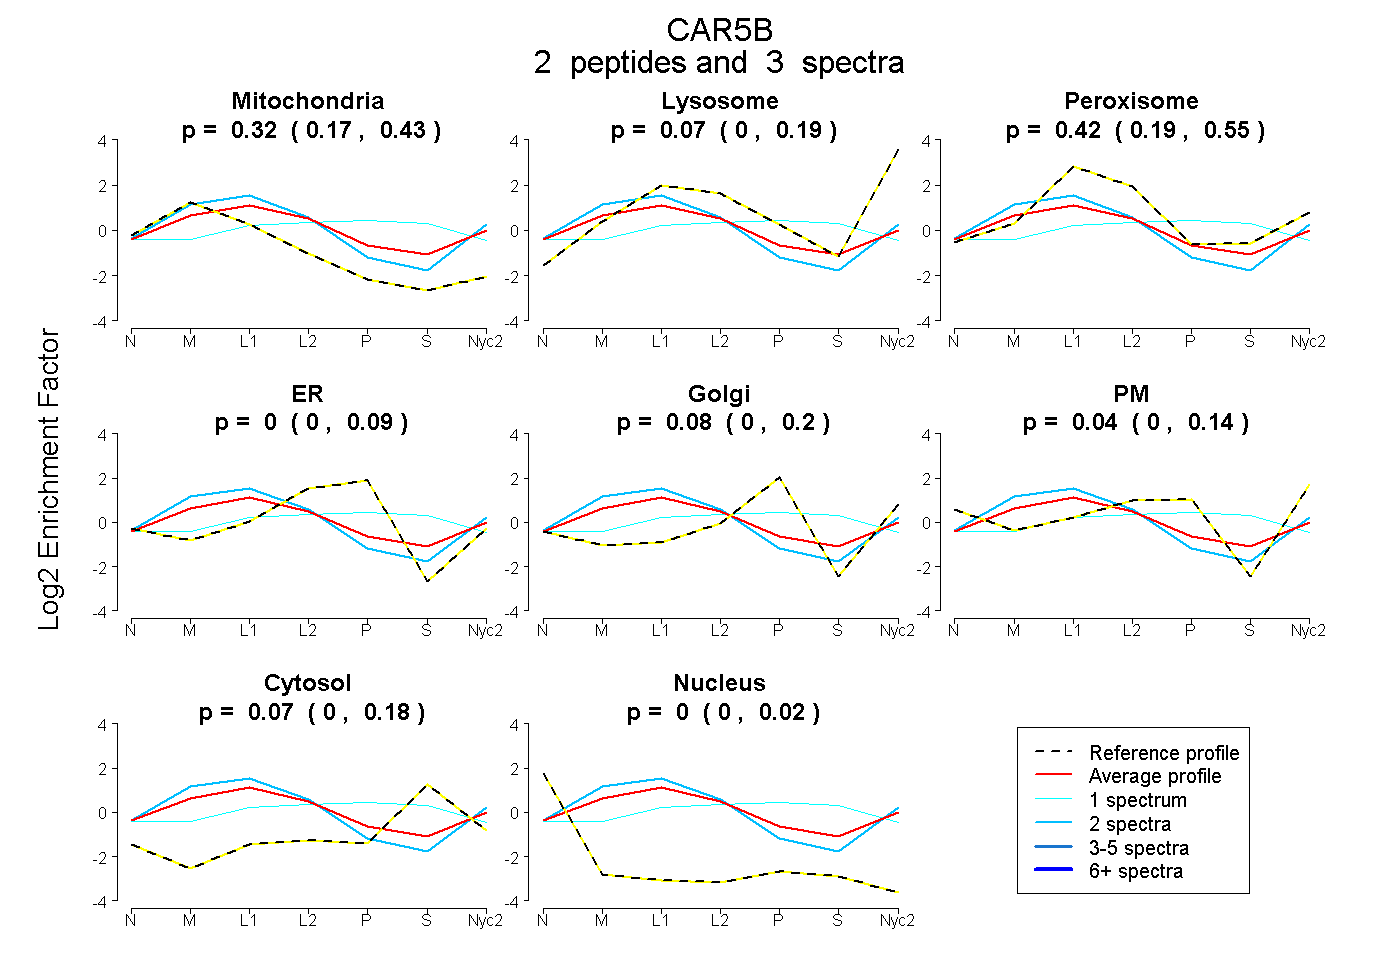
| Expt A |
2 peptides |
3 spectra |
|
0.318 0.167 | 0.434 |
0.067 0.000 | 0.194 |
0.423 0.194 | 0.554 |
0.000 0.000 | 0.089 |
0.079 0.000 | 0.204 |
0.043 0.000 | 0.140 |
0.070 0.000 | 0.180 |
0.000 0.000 | 0.024 |
||
| Plot | Lyso | Other | |||||||||||
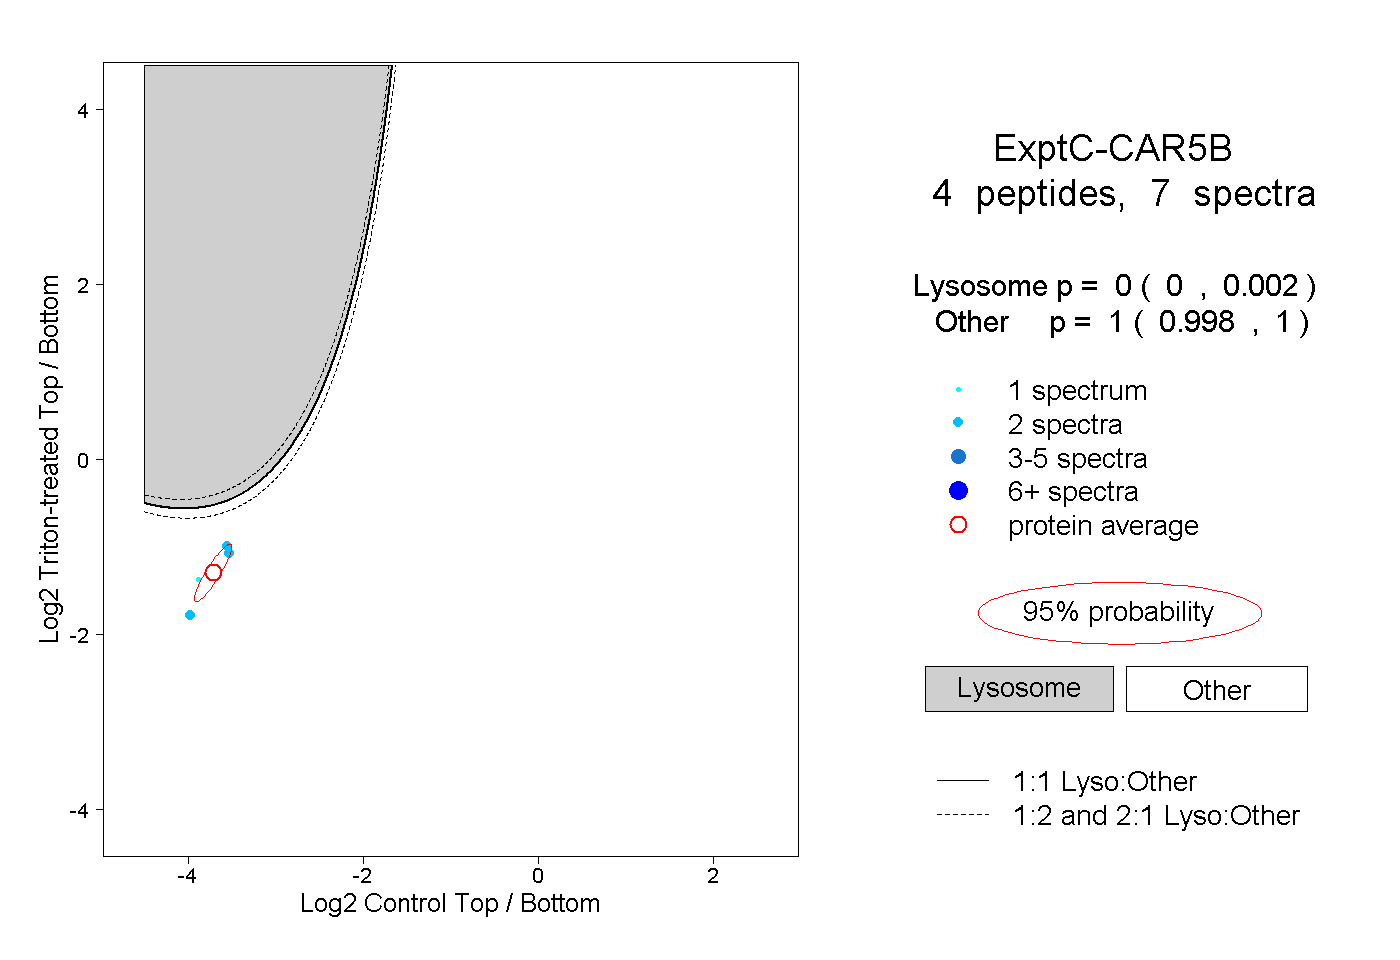
| Expt C |
4 peptides |
7 spectra |
|
0.000 0.000 | 0.002 |
1.000 0.998 | 1.000 |