 10
10peptides
spectra
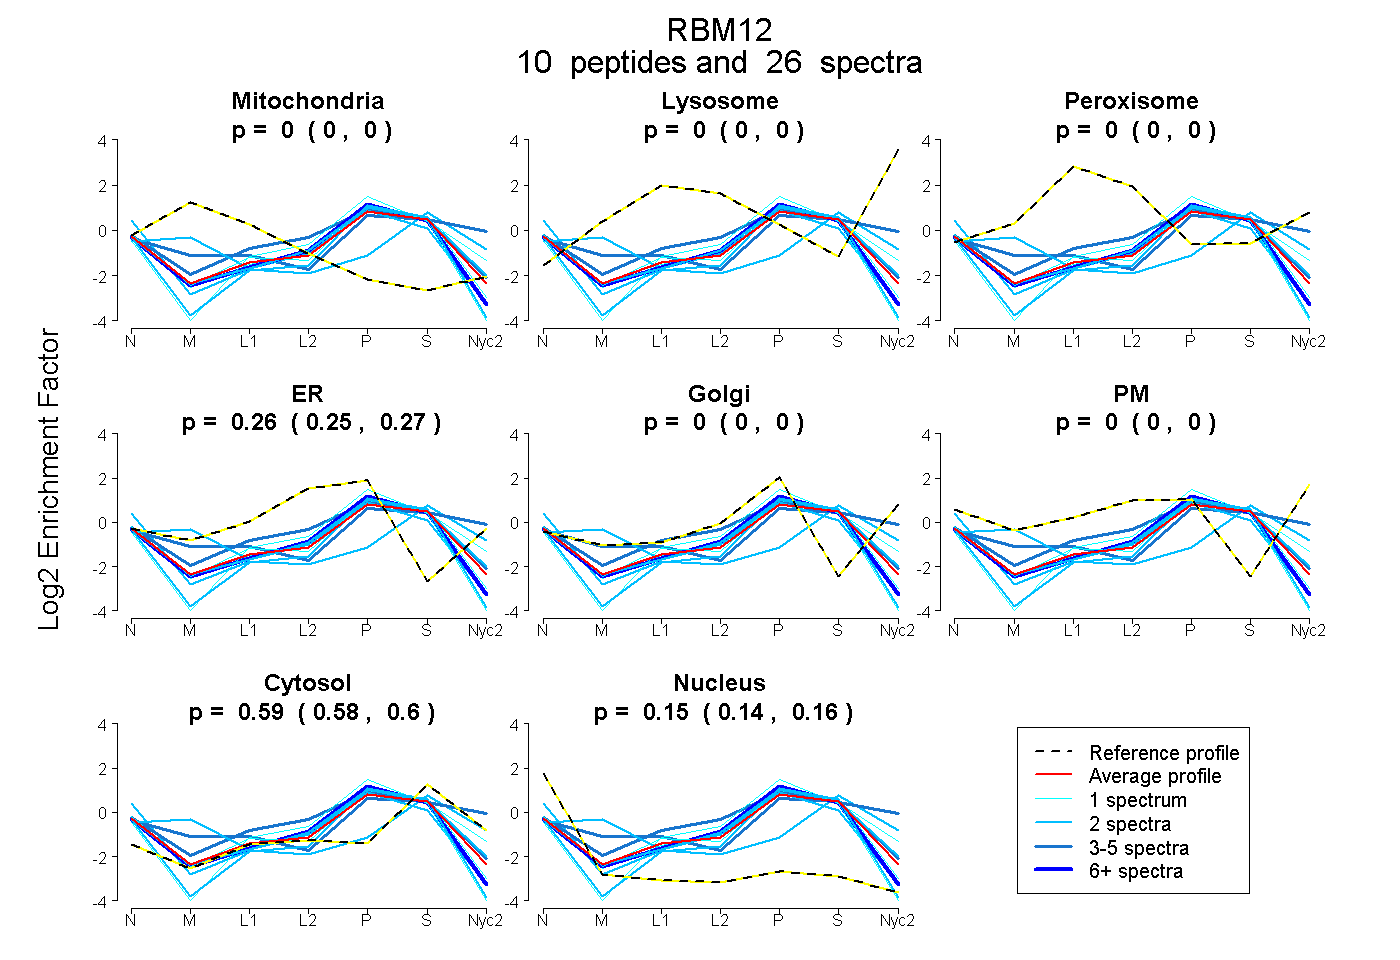
0.000 | 0.000
0.000 | 0.000
0.000 | 0.000
0.250 | 0.271
0.000 | 0.000
0.000 | 0.000
0.578 | 0.597
0.137 | 0.161
4peptides
spectra
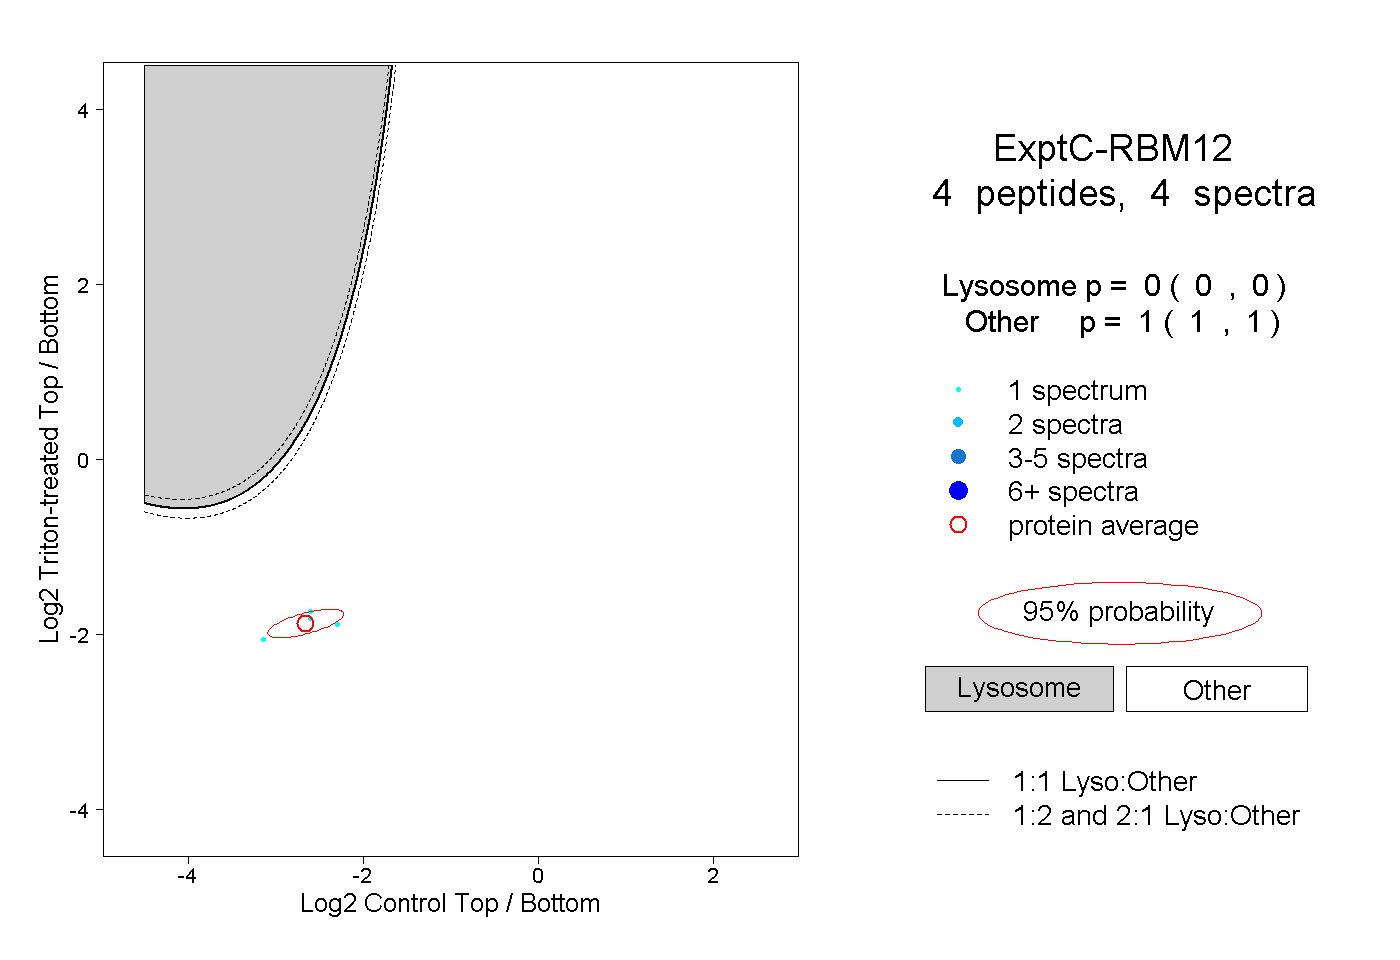
0.000 | 0.000
1.000 | 1.000
2peptides
spectra
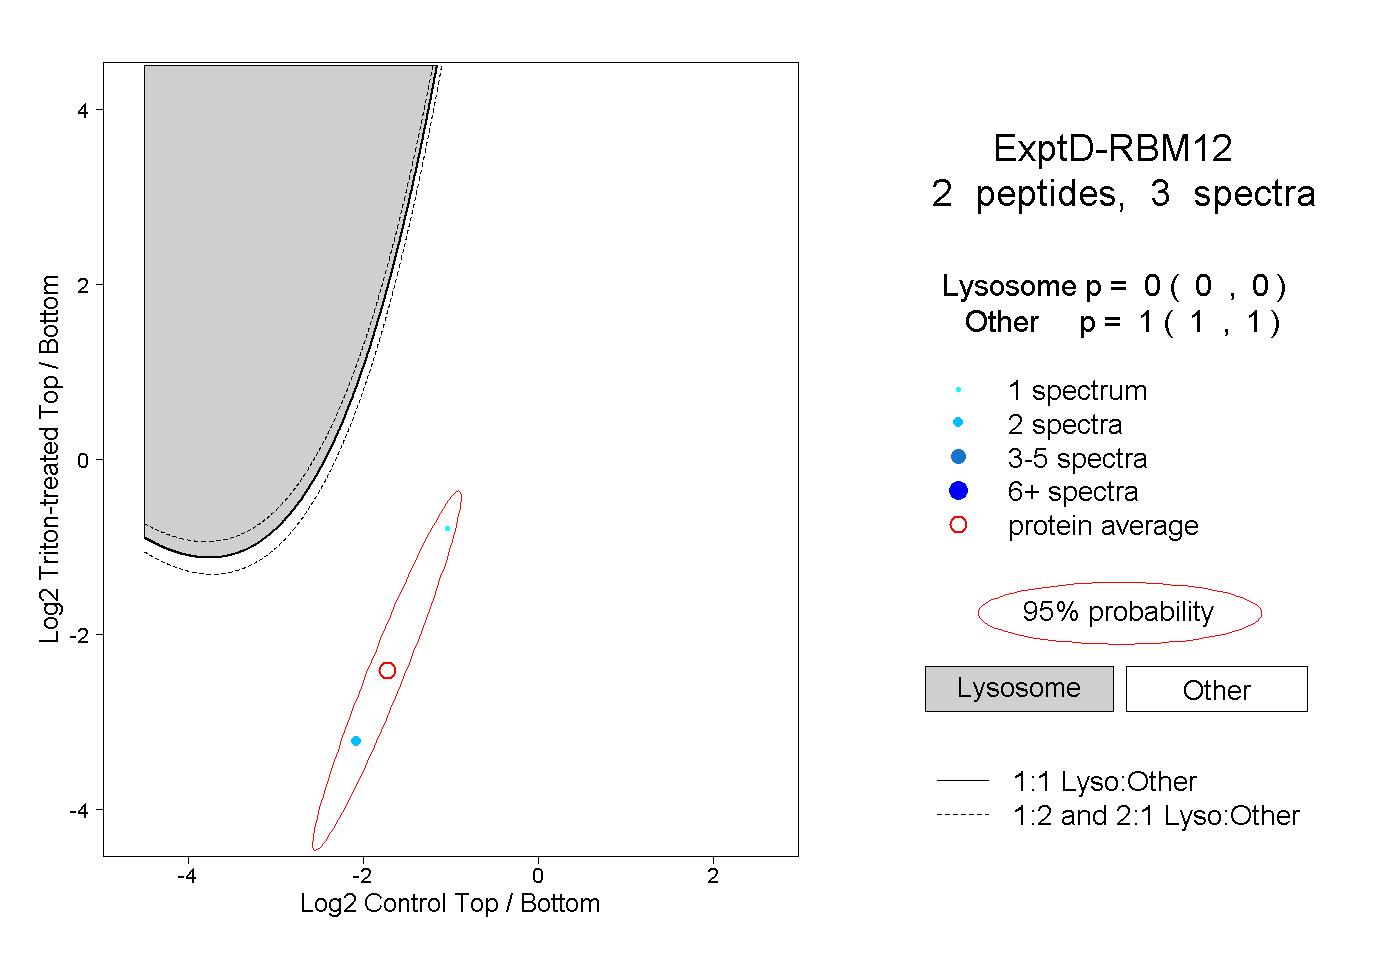
0.000 | 0.000
1.000 | 1.000