 3
3peptides
spectra
0.000 | 0.000
0.277 | 0.426
0.000 | 0.000
0.000 | 0.251
0.000 | 0.000
0.368 | 0.643
0.000 | 0.000
0.000 | 0.000
| Plot | Mito | Lyso | Perox | ER | Golgi | PM | Cytosol | Nucleus | |||||
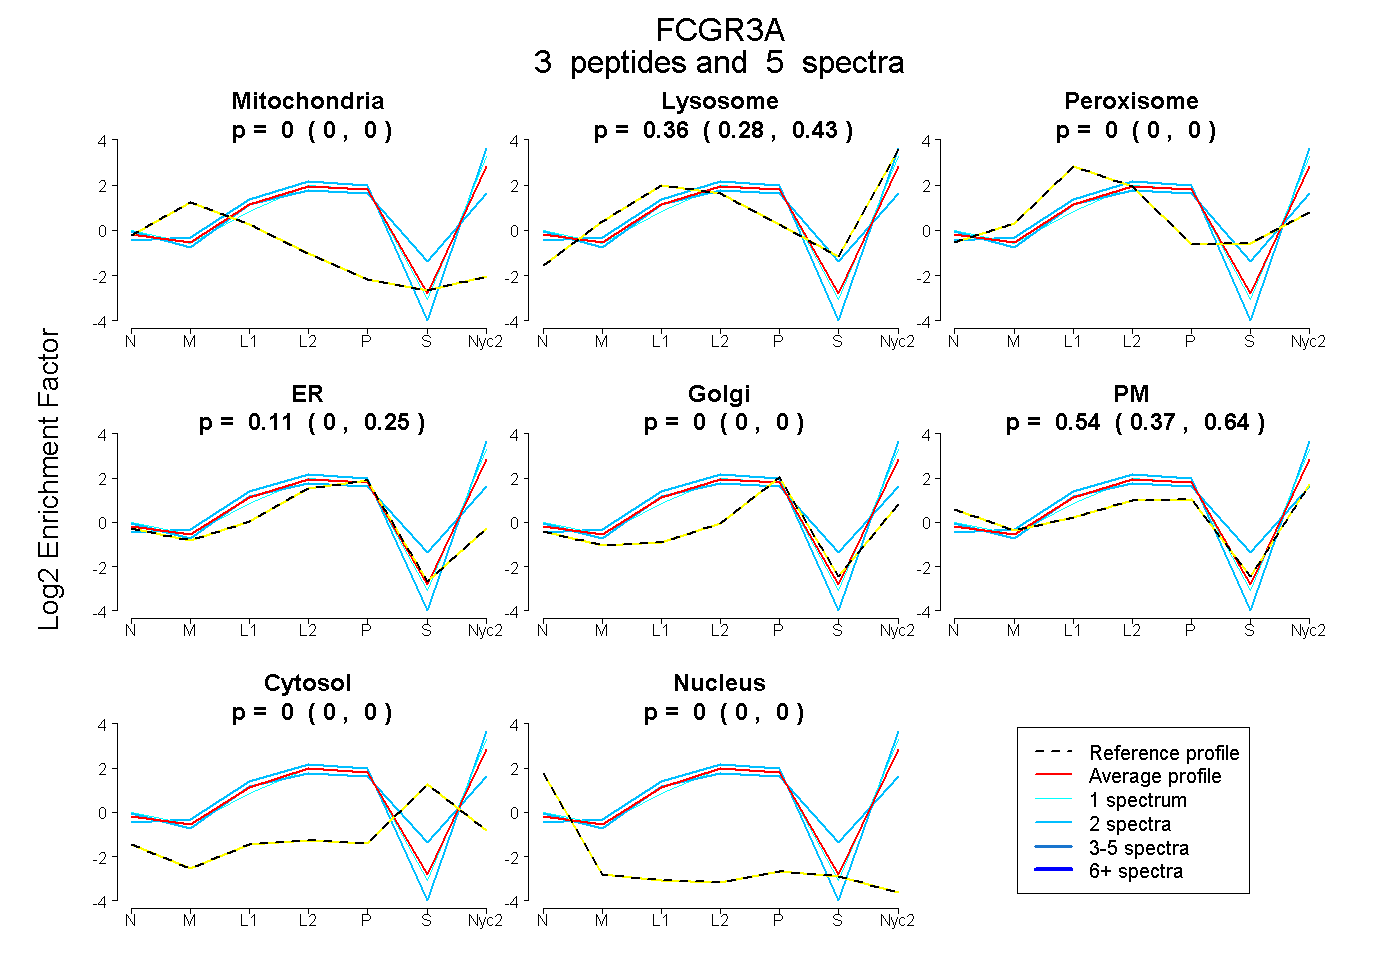
| Expt A |
3 peptides |
5 spectra |
|
0.000 0.000 | 0.000 |
0.356 0.277 | 0.426 |
0.000 0.000 | 0.000 |
0.109 0.000 | 0.251 |
0.000 0.000 | 0.000 |
0.535 0.368 | 0.643 |
0.000 0.000 | 0.000 |
0.000 0.000 | 0.000 |
| 2 spectra, VLEEDCVILR | 0.000 | 0.288 | 0.100 | 0.373 | 0.000 | 0.239 | 0.000 | 0.000 | ||
| 1 spectrum, LFQEGDPIR | 0.000 | 0.300 | 0.000 | 0.000 | 0.000 | 0.700 | 0.000 | 0.000 | ||
| 2 spectra, AVVILDPEWVR | 0.000 | 0.412 | 0.000 | 0.000 | 0.000 | 0.588 | 0.000 | 0.000 |
| Plot | Lyso | Other | |||||||||||
| Expt C |
4 peptides |
7 spectra |
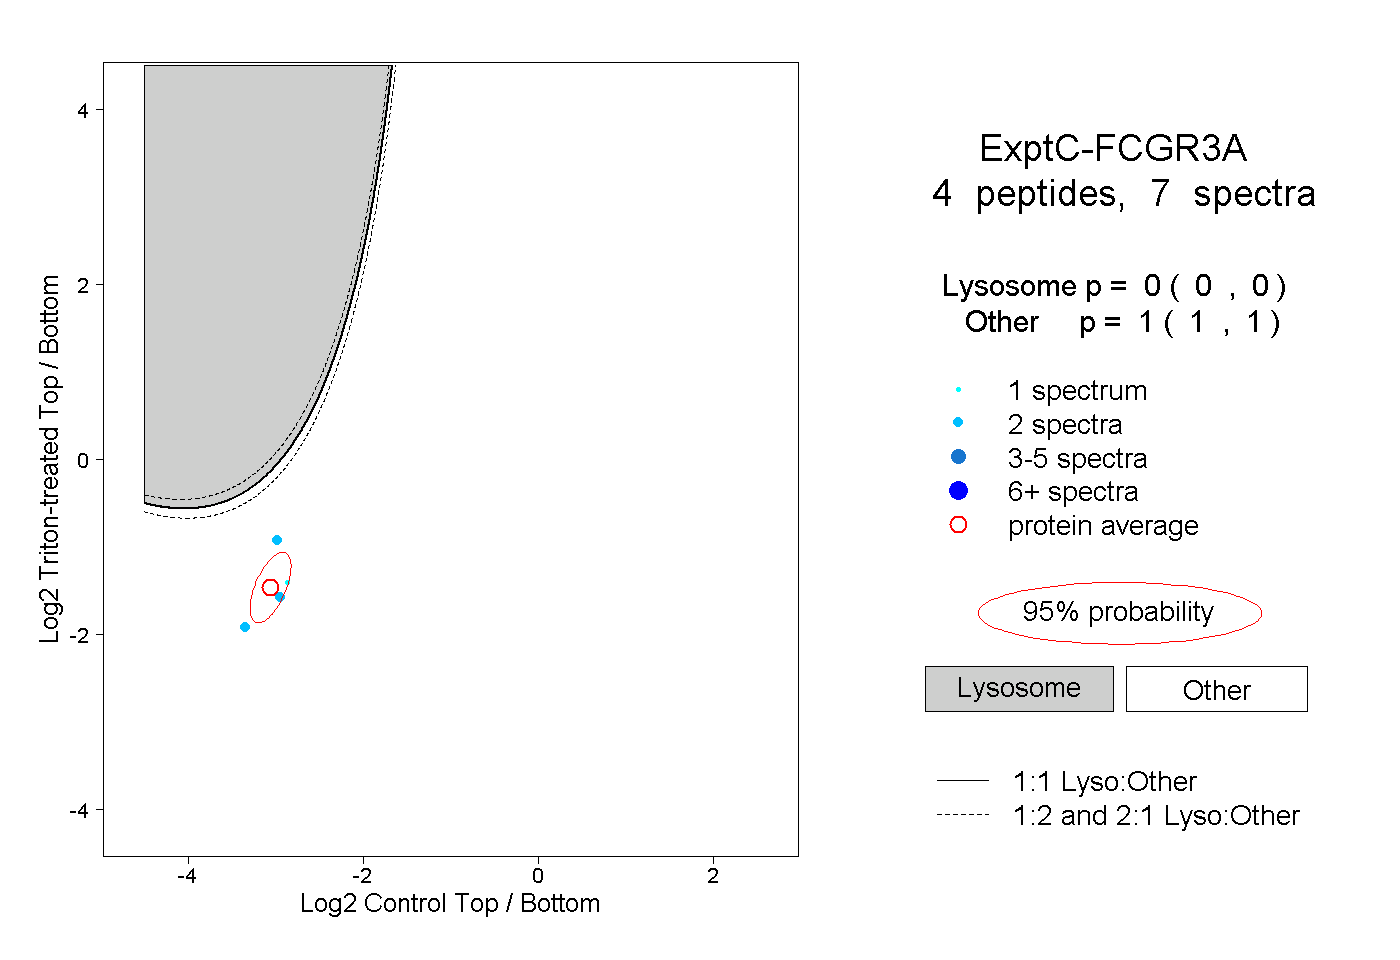 |
0.000 0.000 | 0.000 |
1.000 1.000 | 1.000 |
||||||||
| Plot | Lyso | Other | |||||||||||
| Expt D |
1 peptide |
1 spectrum |
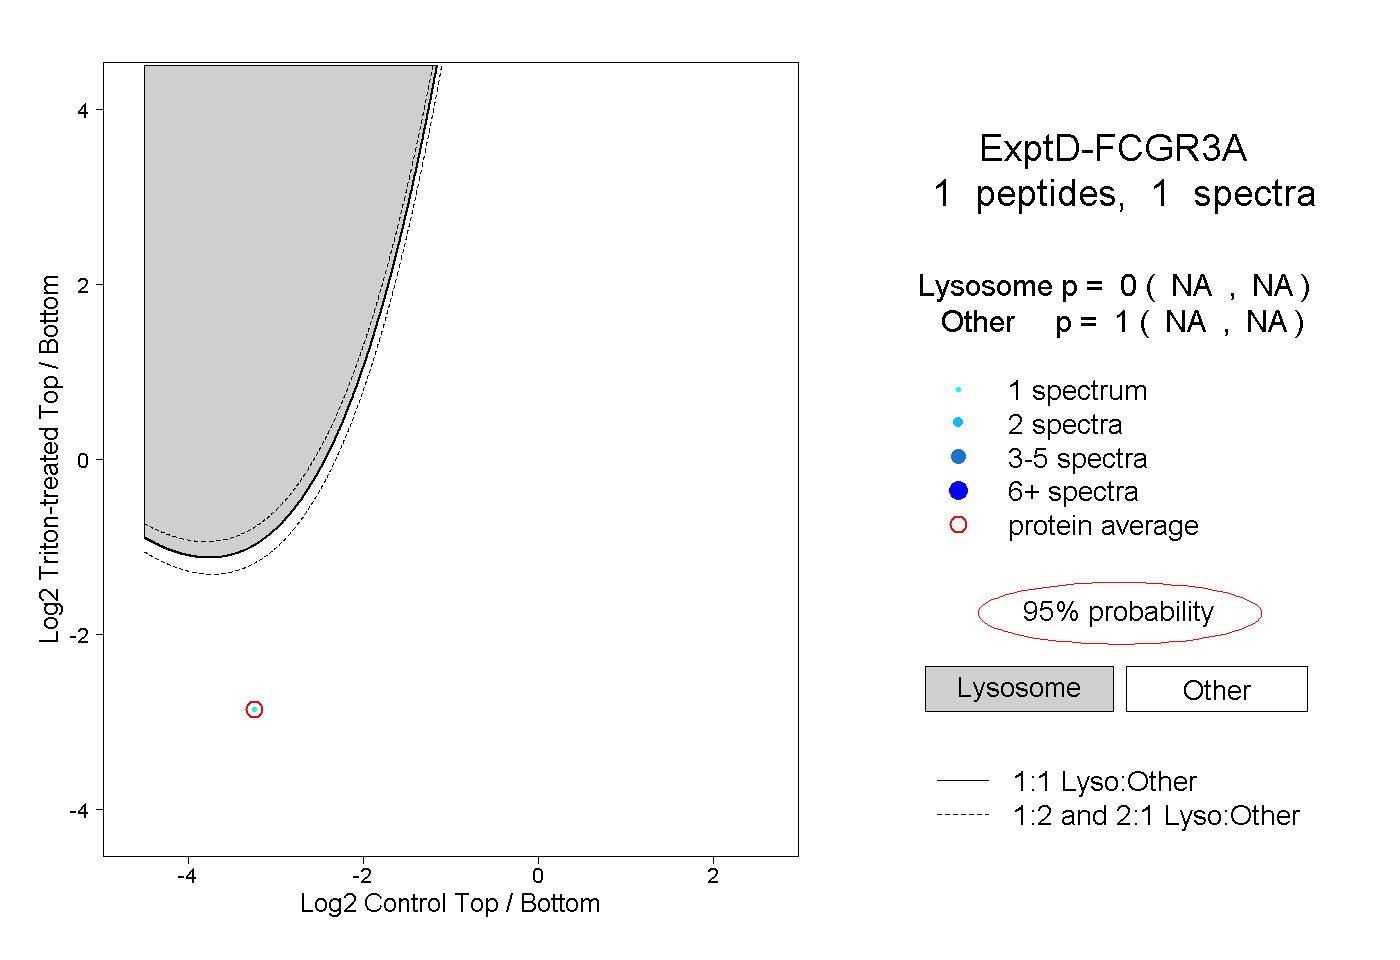 |
0.000 NA | NA |
1.000 NA | NA |