 10
10peptides
spectra
0.000 | 0.000
0.000 | 0.000
0.000 | 0.000
0.000 | 0.000
0.009 | 0.012
0.000 | 0.000
0.988 | 0.991
0.000 | 0.000
| Plot | Mito | Lyso | Perox | ER | Golgi | PM | Cytosol | Nucleus | |||||
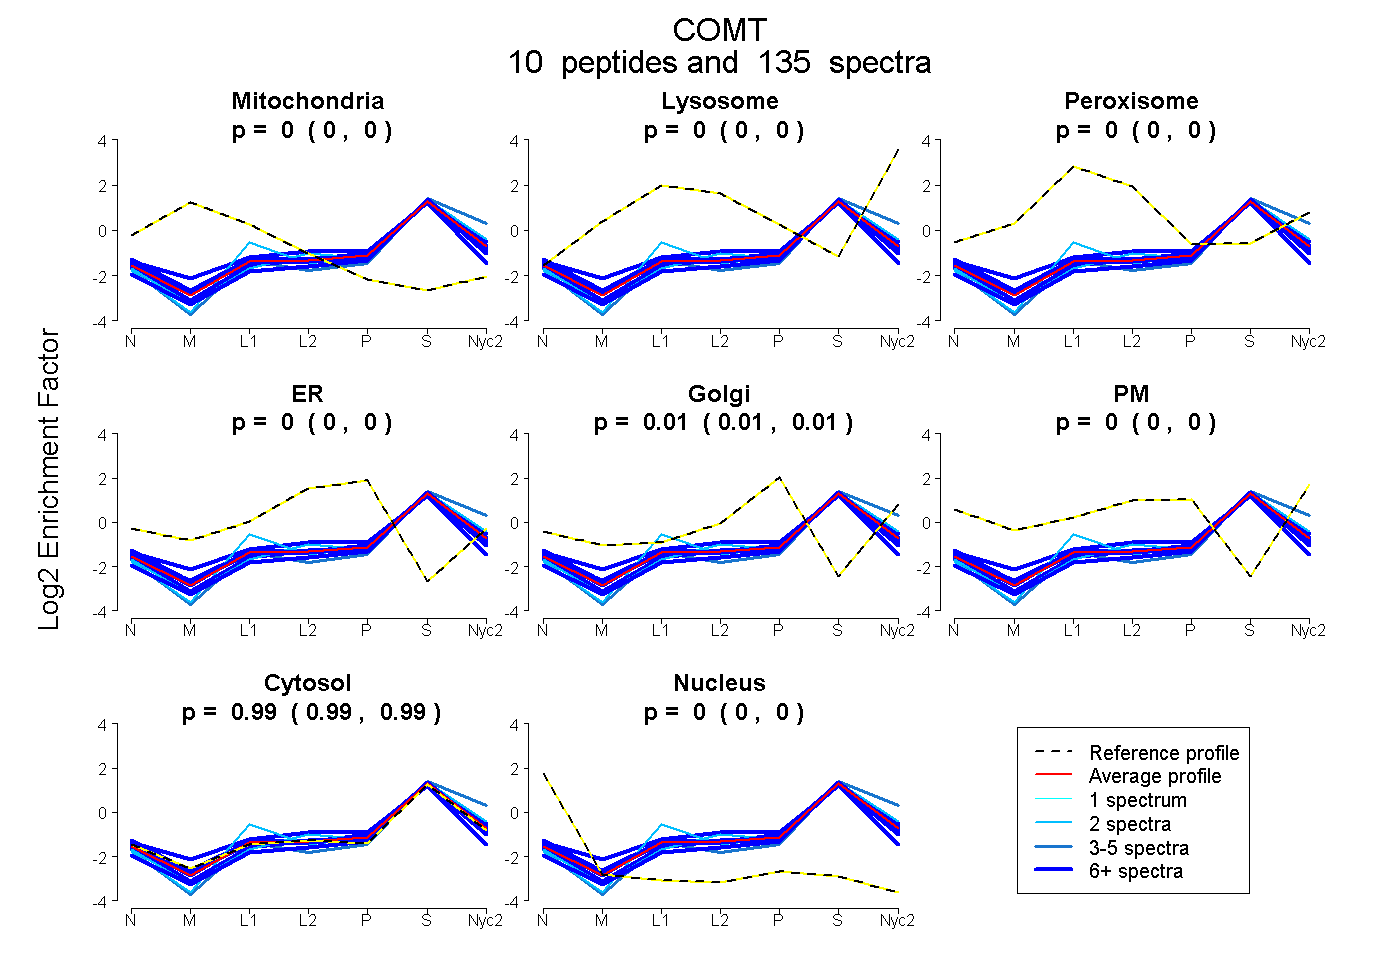
| Expt A |
10 peptides |
135 spectra |
|
0.000 0.000 | 0.000 |
0.000 0.000 | 0.000 |
0.000 0.000 | 0.000 |
0.000 0.000 | 0.000 |
0.010 0.009 | 0.012 |
0.000 0.000 | 0.000 |
0.990 0.988 | 0.991 |
0.000 0.000 | 0.000 |
| 2 spectra, VTILNGASQDLIPQLK | 0.000 | 0.000 | 0.000 | 0.000 | 0.000 | 0.000 | 1.000 | 0.000 | ||
| 17 spectra, LLQPGAR | 0.000 | 0.000 | 0.000 | 0.000 | 0.000 | 0.000 | 1.000 | 0.000 | ||
| 7 spectra, YDVDTLDMVFLDHWK | 0.000 | 0.000 | 0.000 | 0.000 | 0.000 | 0.000 | 1.000 | 0.000 | ||
| 2 spectra, GSSSFECTHYSSYLEYMK | 0.000 | 0.024 | 0.000 | 0.000 | 0.000 | 0.000 | 0.976 | 0.000 | ||
| 19 spectra, EWAMNVGDAK | 0.000 | 0.027 | 0.000 | 0.000 | 0.014 | 0.000 | 0.960 | 0.000 | ||
| 4 spectra, AIYQGPSSPDK | 0.000 | 0.000 | 0.000 | 0.000 | 0.000 | 0.000 | 1.000 | 0.000 | ||
| 22 spectra, VVDGLEK | 0.000 | 0.000 | 0.000 | 0.000 | 0.025 | 0.000 | 0.971 | 0.004 | ||
| 24 spectra, YLPDTLLLEK | 0.000 | 0.000 | 0.000 | 0.000 | 0.000 | 0.000 | 0.994 | 0.006 | ||
| 13 spectra, CGLLR | 0.030 | 0.000 | 0.000 | 0.065 | 0.000 | 0.000 | 0.905 | 0.000 | ||
| 25 spectra, GQIMDAVIR | 0.000 | 0.000 | 0.000 | 0.000 | 0.034 | 0.000 | 0.966 | 0.000 |
| Plot | Mito | Lyso or Perox | ER | Golgi | PM | Cytosol | Nucleus | ||||||
| Expt B |
7 peptides |
82 spectra |
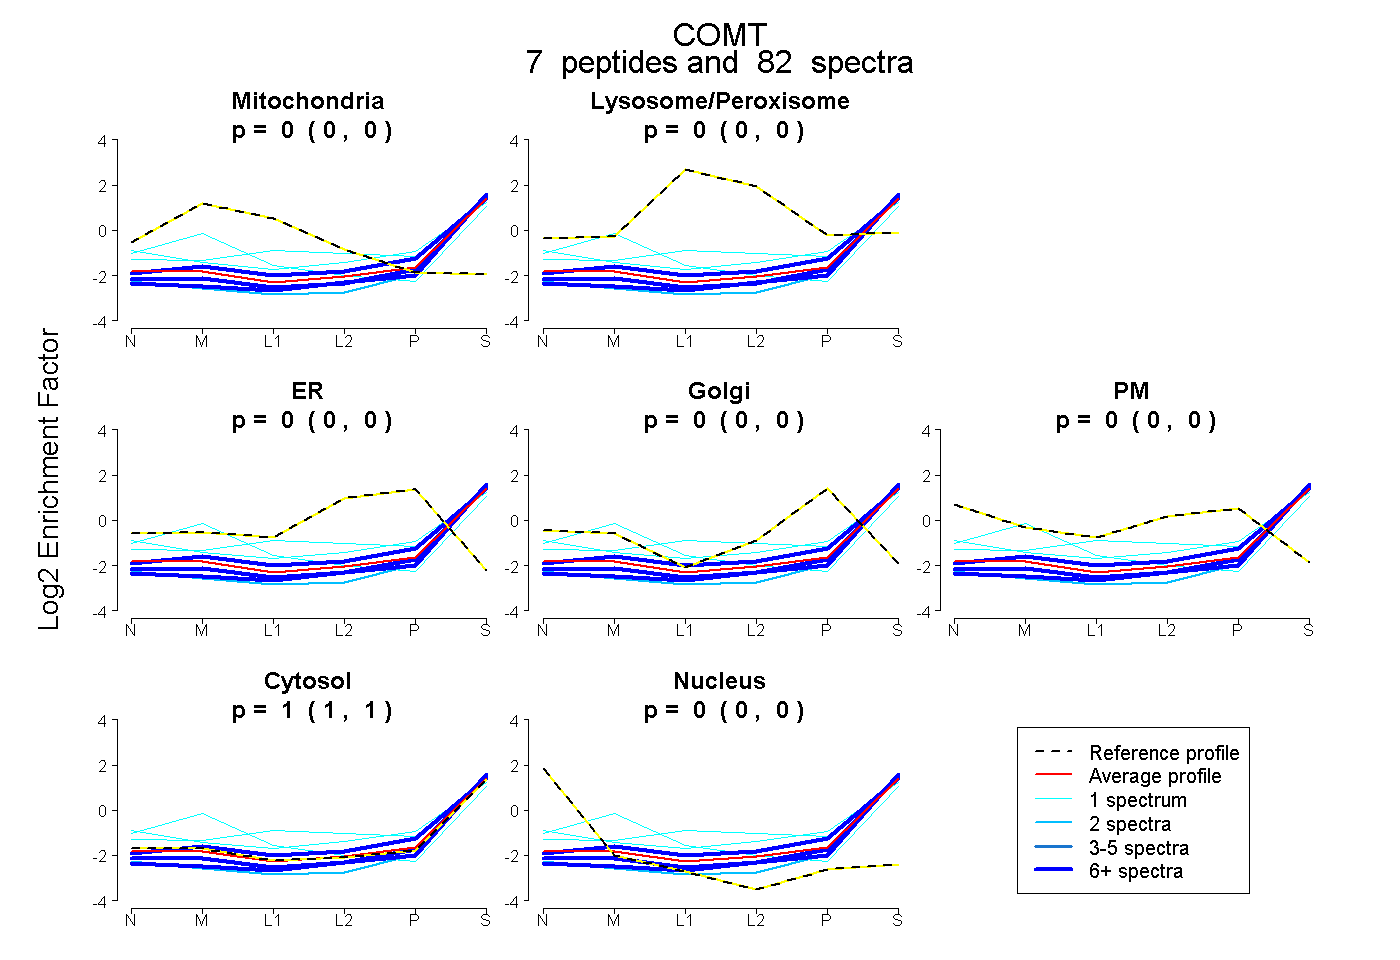 |
0.000 0.000 | 0.000 |
0.000 0.000 | 0.000 |
0.000 0.000 | 0.000 |
0.000 0.000 | 0.003 |
0.000 0.000 | 0.000 |
1.000 0.995 | 1.000 |
0.000 0.000 | 0.000 |
|||
| Plot | Lyso | Other | |||||||||||
| Expt C |
8 peptides |
199 spectra |
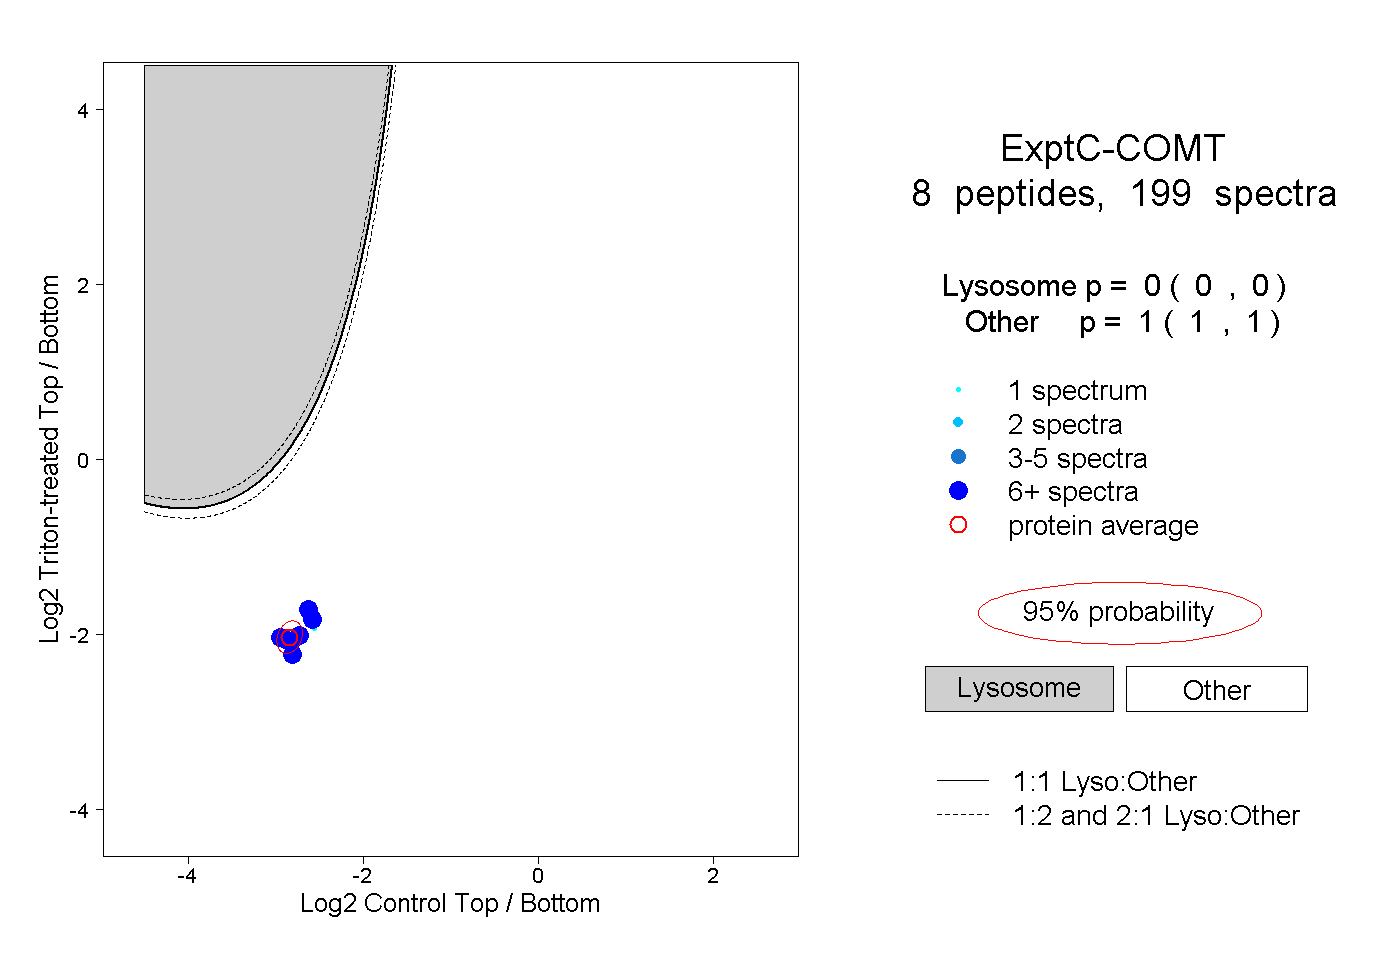 |
0.000 0.000 | 0.000 |
1.000 1.000 | 1.000 |
||||||||
| Plot | Lyso | Other | |||||||||||
| Expt D |
5 peptides |
25 spectra |
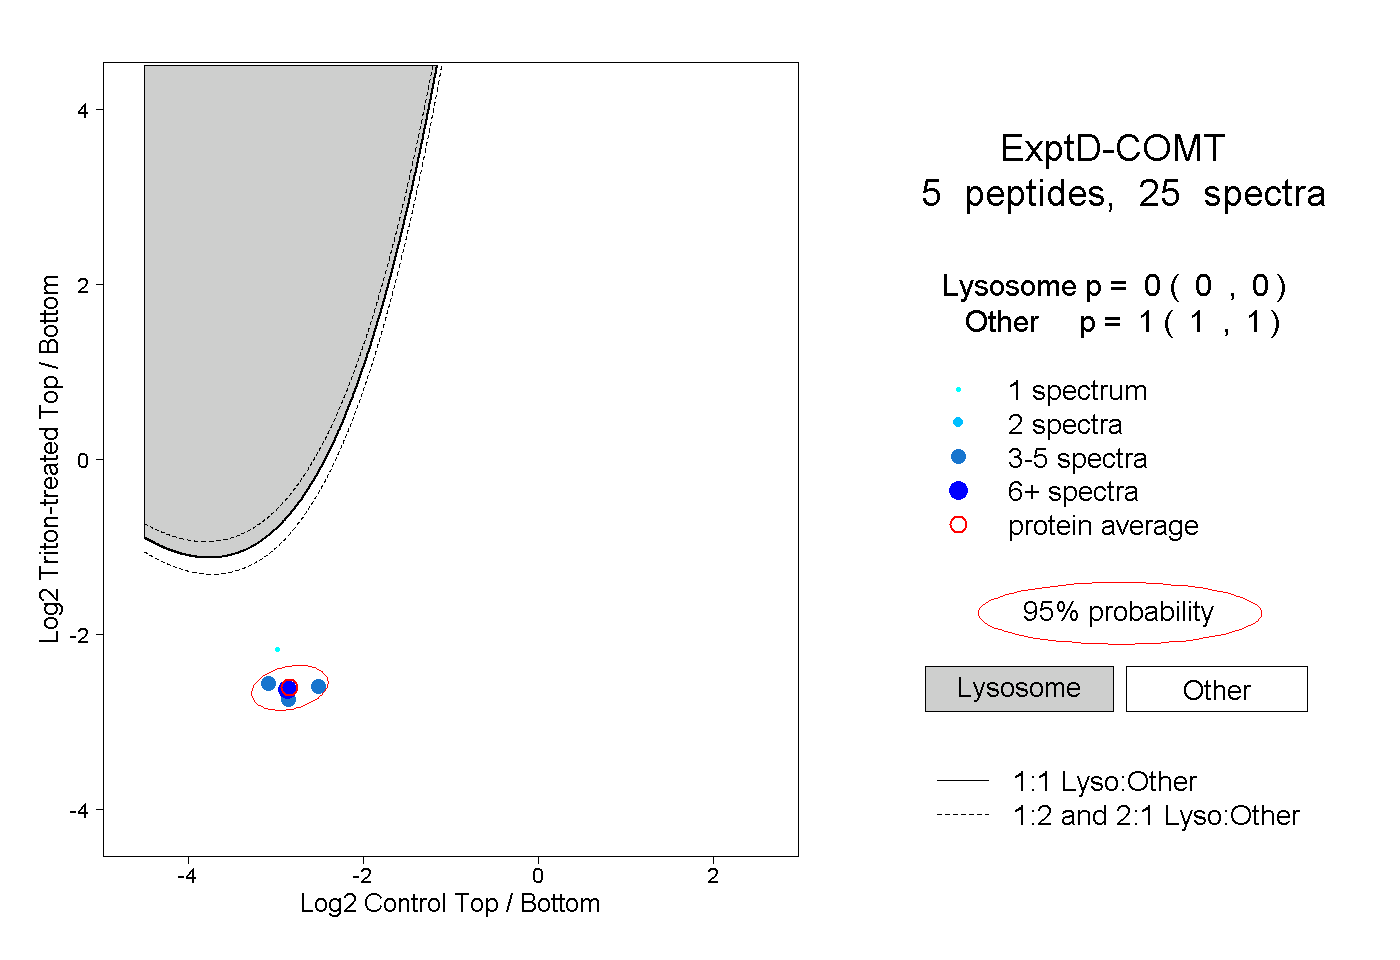 |
0.000 0.000 | 0.000 |
1.000 1.000 | 1.000 |