14
14peptides
spectra
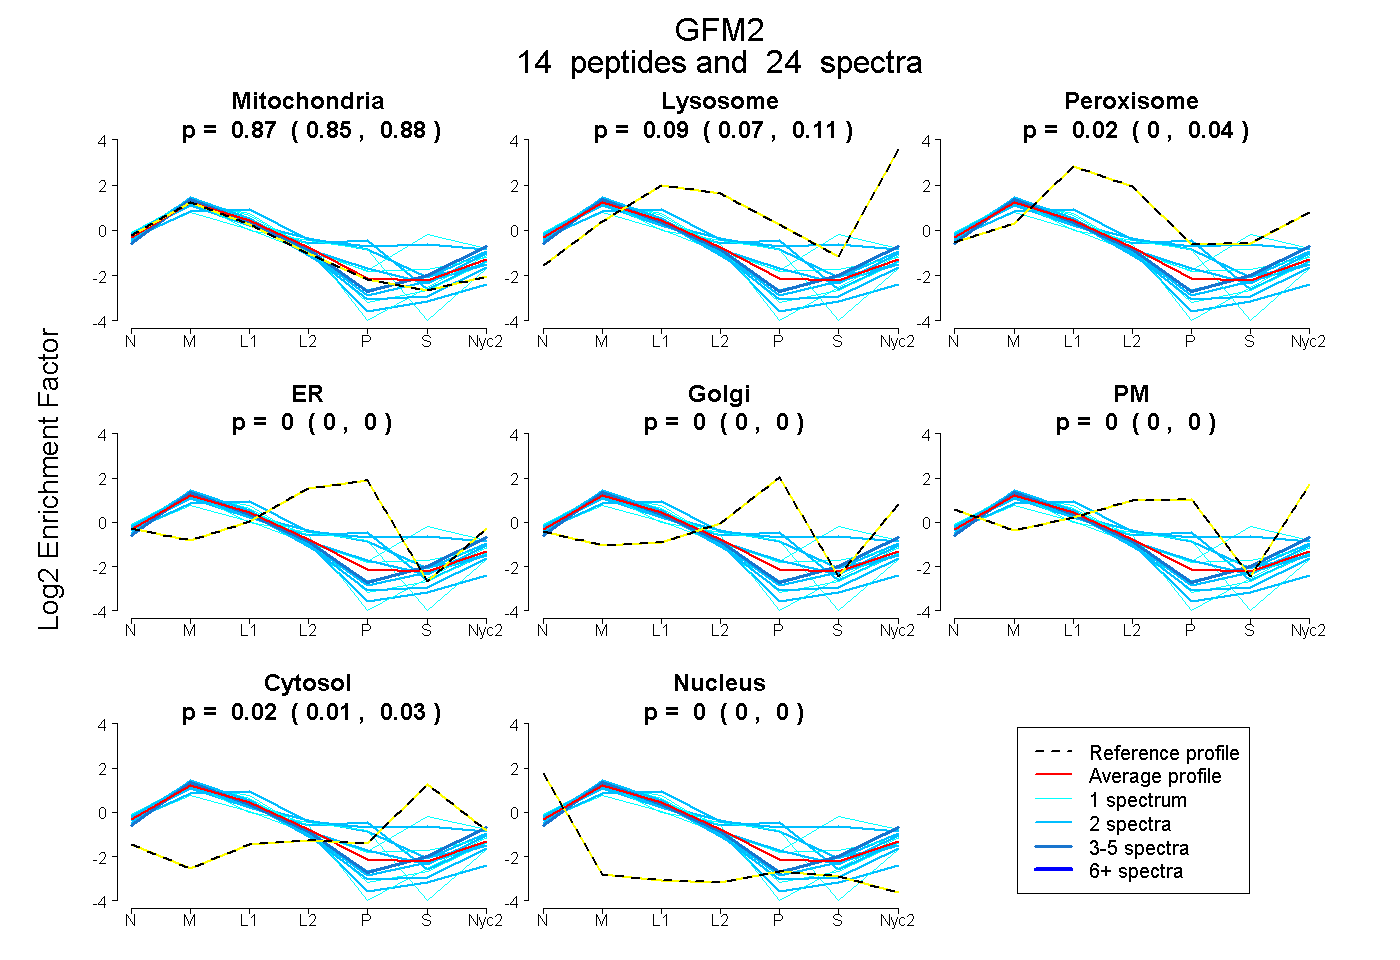
0.852 | 0.880
0.074 | 0.110
0.000 | 0.037
0.000 | 0.000
0.000 | 0.000
0.000 | 0.000
0.008 | 0.028
0.000 | 0.000
4peptides
spectra
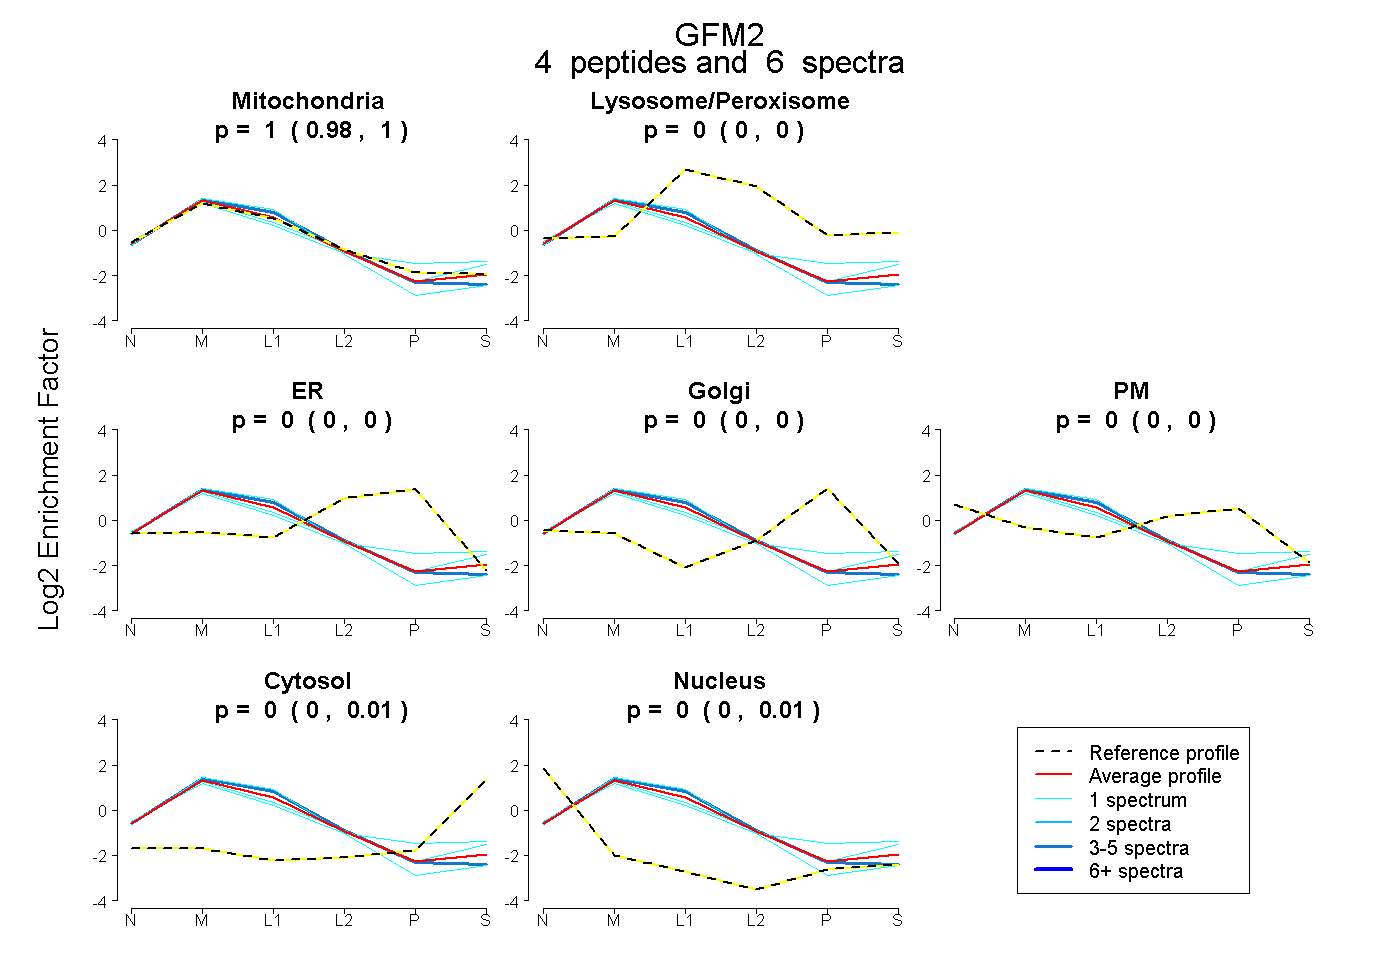
0.983 | 1.000
0.000 | 0.000
0.000 | 0.000
0.000 | 0.000
0.000 | 0.000
0.000 | 0.008
0.000 | 0.010
18peptides
spectra
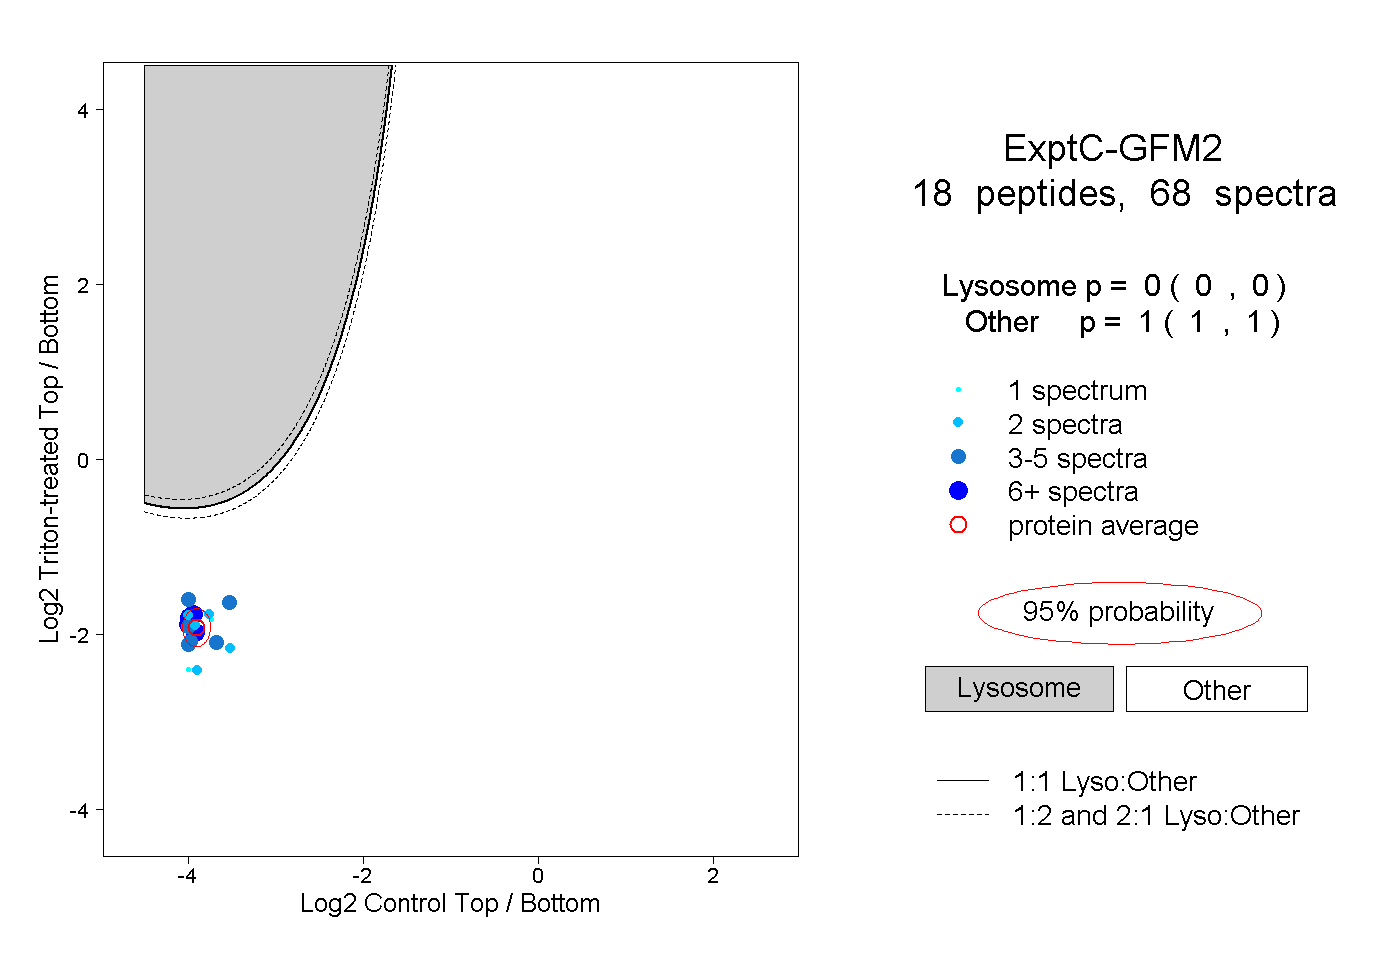
0.000 | 0.000
1.000 | 1.000