 14
14peptides
spectra
0.852 | 0.880
0.074 | 0.110
0.000 | 0.037
0.000 | 0.000
0.000 | 0.000
0.000 | 0.000
0.008 | 0.028
0.000 | 0.000
| Plot | Mito | Lyso | Perox | ER | Golgi | PM | Cytosol | Nucleus | |||||
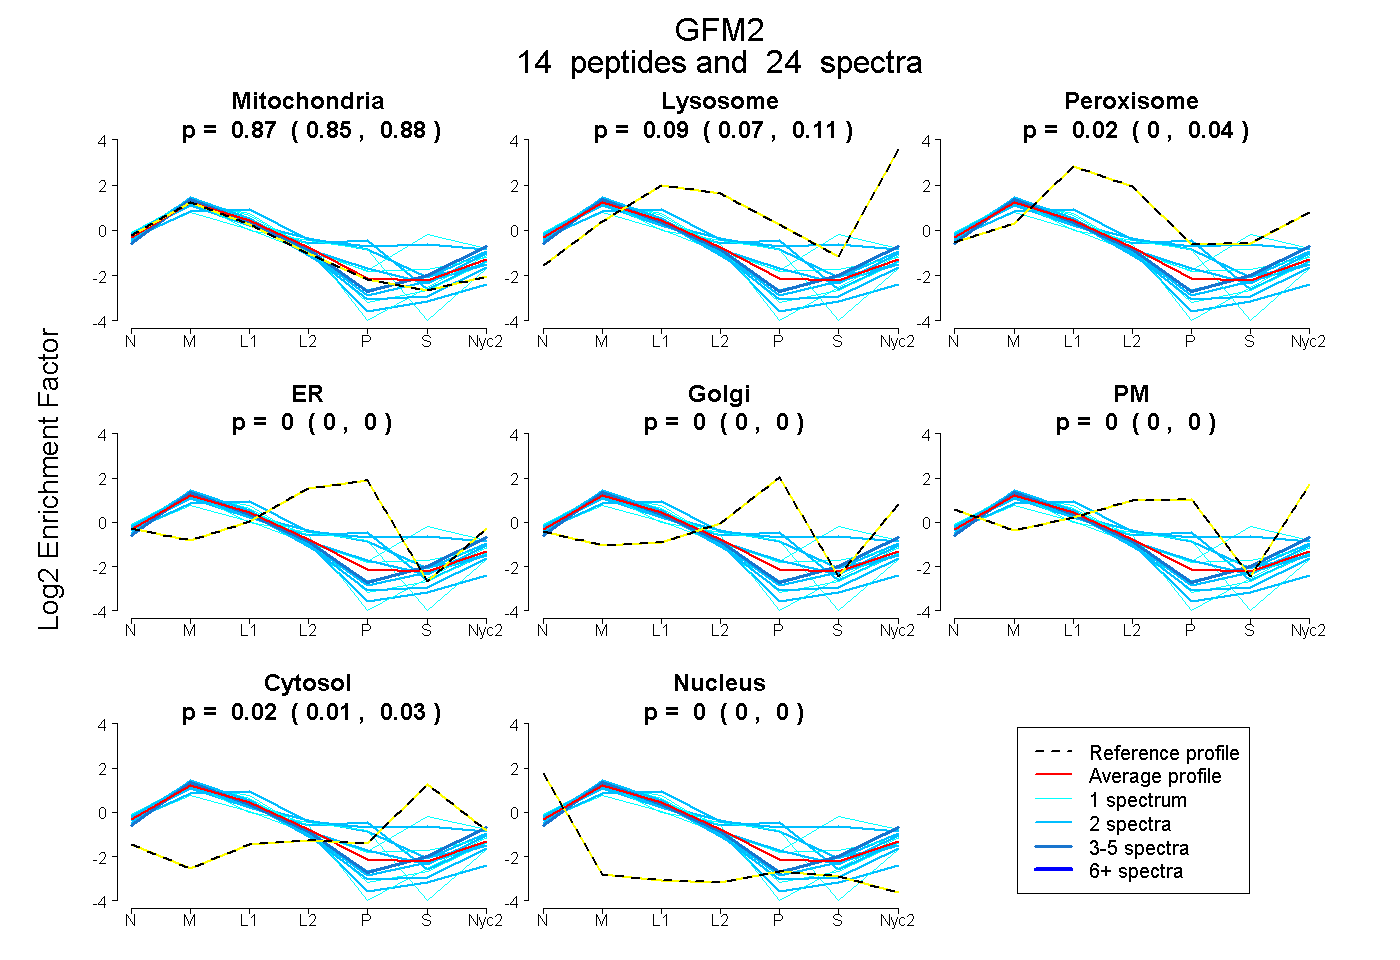
| Expt A |
14 peptides |
24 spectra |
|
0.867 0.852 | 0.880 |
0.095 0.074 | 0.110 |
0.019 0.000 | 0.037 |
0.000 0.000 | 0.000 |
0.000 0.000 | 0.000 |
0.000 0.000 | 0.000 |
0.019 0.008 | 0.028 |
0.000 0.000 | 0.000 |
| 1 spectrum, ETVEAR | 0.499 | 0.037 | 0.142 | 0.000 | 0.000 | 0.000 | 0.323 | 0.000 | ||
| 1 spectrum, LQAAIHR | 0.754 | 0.000 | 0.000 | 0.246 | 0.000 | 0.000 | 0.000 | 0.000 | ||
| 2 spectra, GPLVFLR | 1.000 | 0.000 | 0.000 | 0.000 | 0.000 | 0.000 | 0.000 | 0.000 | ||
| 2 spectra, SSALAAAR | 0.908 | 0.009 | 0.036 | 0.000 | 0.000 | 0.000 | 0.047 | 0.000 | ||
| 2 spectra, ETILNSVR | 0.683 | 0.002 | 0.000 | 0.182 | 0.133 | 0.000 | 0.000 | 0.000 | ||
| 2 spectra, TGASFNYAVESIR | 0.995 | 0.005 | 0.000 | 0.000 | 0.000 | 0.000 | 0.000 | 0.000 | ||
| 2 spectra, EHGFLQWYK | 0.654 | 0.050 | 0.104 | 0.000 | 0.166 | 0.025 | 0.000 | 0.000 | ||
| 1 spectrum, KPLSEASDPTLLK | 0.758 | 0.028 | 0.162 | 0.000 | 0.000 | 0.000 | 0.053 | 0.000 | ||
| 2 spectra, QTATGDTIVSSK | 0.829 | 0.138 | 0.000 | 0.000 | 0.029 | 0.001 | 0.000 | 0.002 | ||
| 2 spectra, SLHSIINPPVAK | 0.432 | 0.000 | 0.356 | 0.000 | 0.050 | 0.000 | 0.163 | 0.000 | ||
| 1 spectrum, EYLSPVLADLAQR | 0.950 | 0.018 | 0.032 | 0.000 | 0.000 | 0.000 | 0.000 | 0.000 | ||
| 3 spectra, TLLSQR | 0.820 | 0.145 | 0.000 | 0.000 | 0.000 | 0.000 | 0.035 | 0.000 | ||
| 1 spectrum, QPDLDHALEHLQR | 0.950 | 0.034 | 0.016 | 0.000 | 0.000 | 0.000 | 0.000 | 0.000 | ||
| 2 spectra, GNIQEIQTR | 0.939 | 0.026 | 0.027 | 0.000 | 0.000 | 0.000 | 0.008 | 0.000 |
| Plot | Mito | Lyso or Perox | ER | Golgi | PM | Cytosol | Nucleus | ||||||
| Expt B |
4 peptides |
6 spectra |
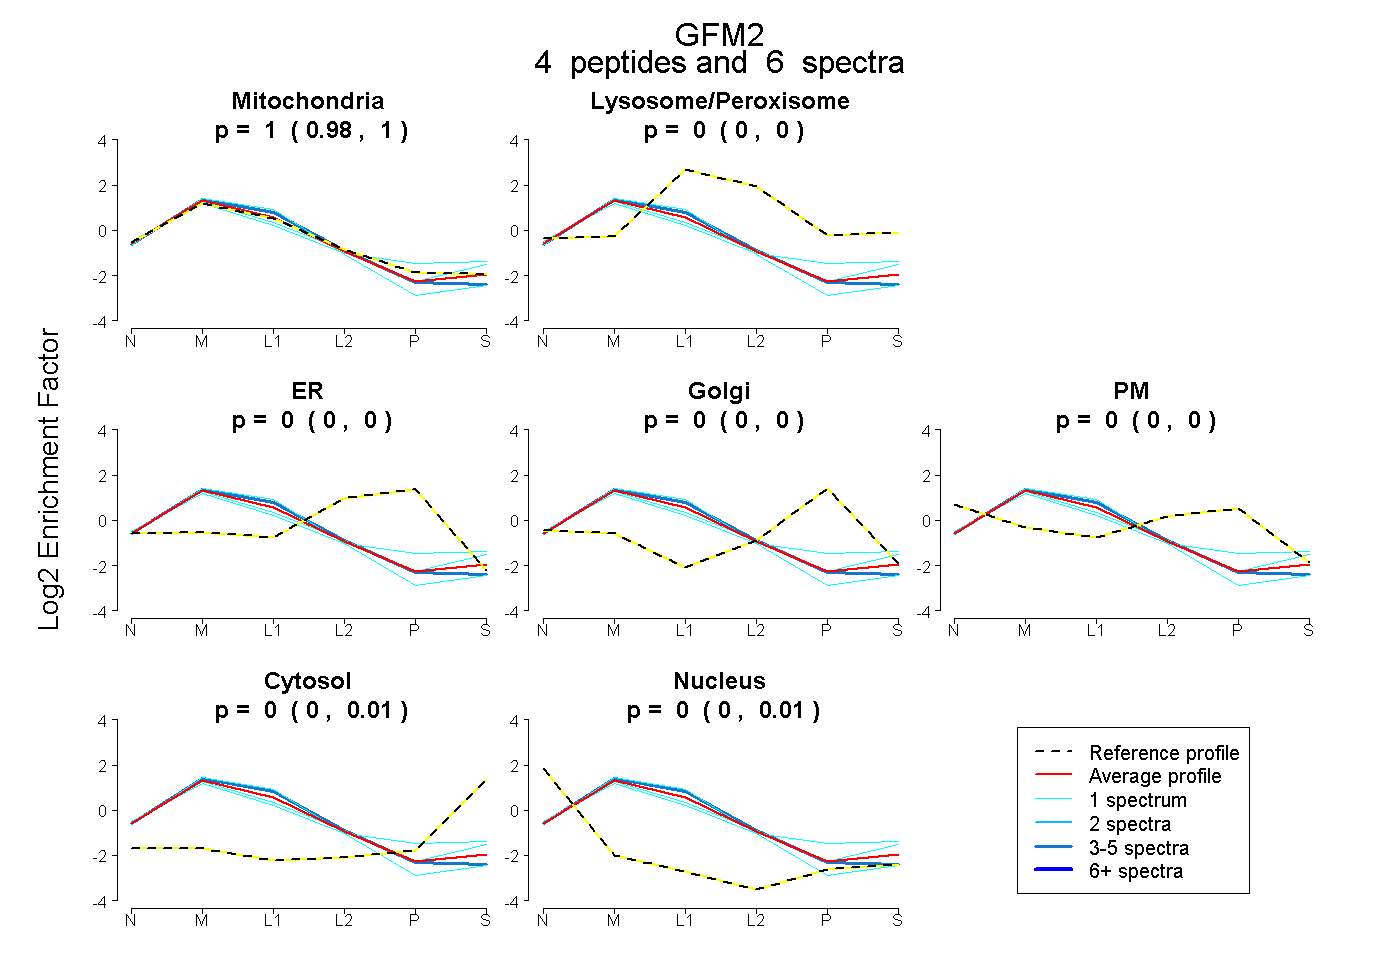 |
1.000 0.983 | 1.000 |
0.000 0.000 | 0.000 |
0.000 0.000 | 0.000 |
0.000 0.000 | 0.000 |
0.000 0.000 | 0.000 |
0.000 0.000 | 0.008 |
0.000 0.000 | 0.010 |
|||
| Plot | Lyso | Other | |||||||||||
| Expt C |
18 peptides |
68 spectra |
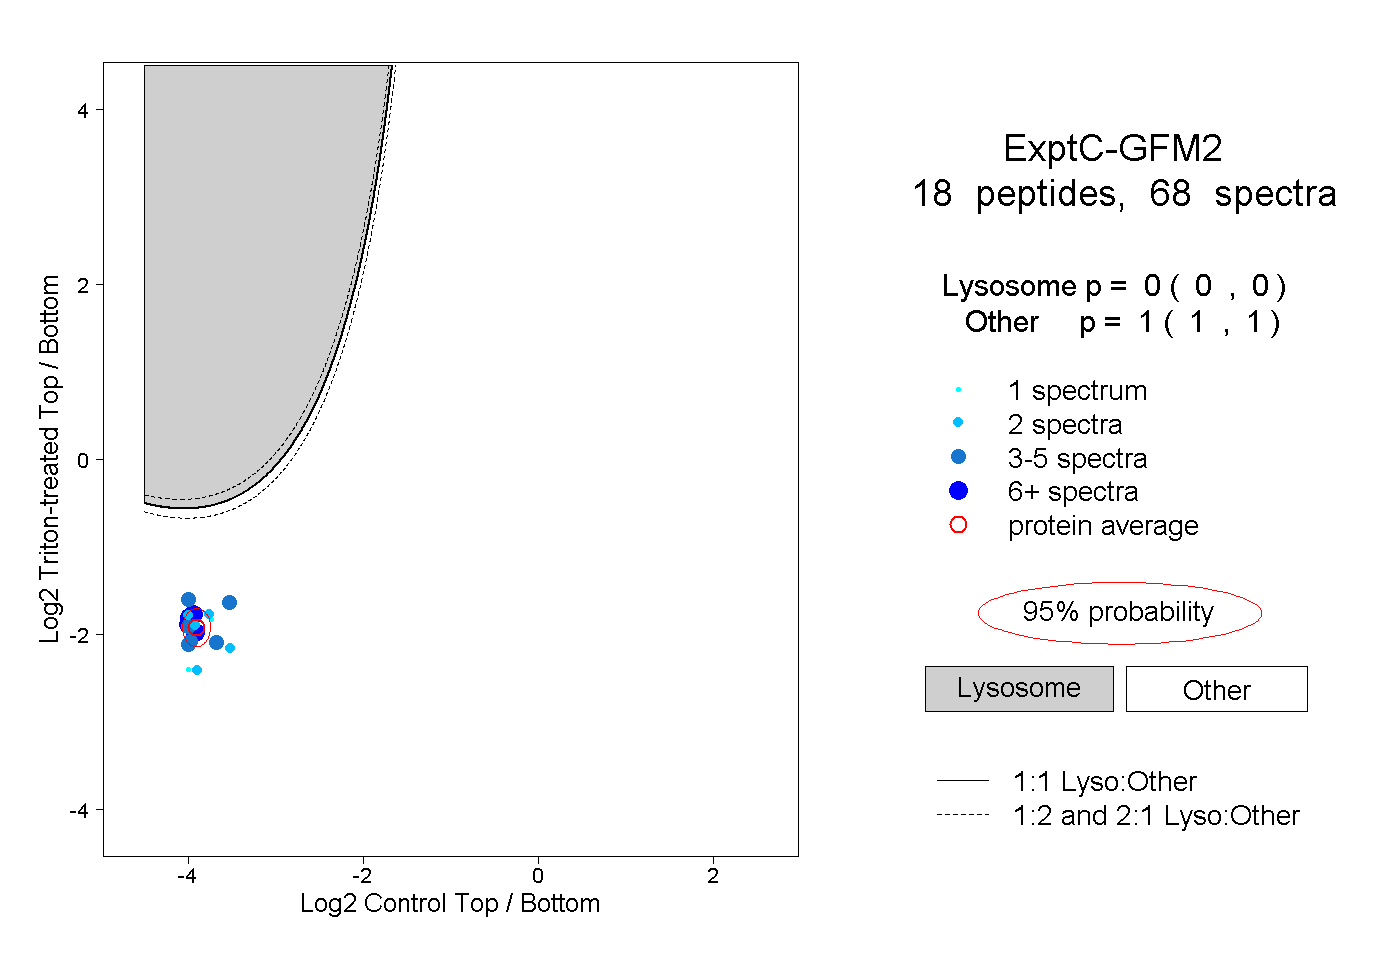 |
0.000 0.000 | 0.000 |
1.000 1.000 | 1.000 |
||||||||
| Plot | Lyso | Other | |||||||||||
| Expt D |
3 peptides |
6 spectra |
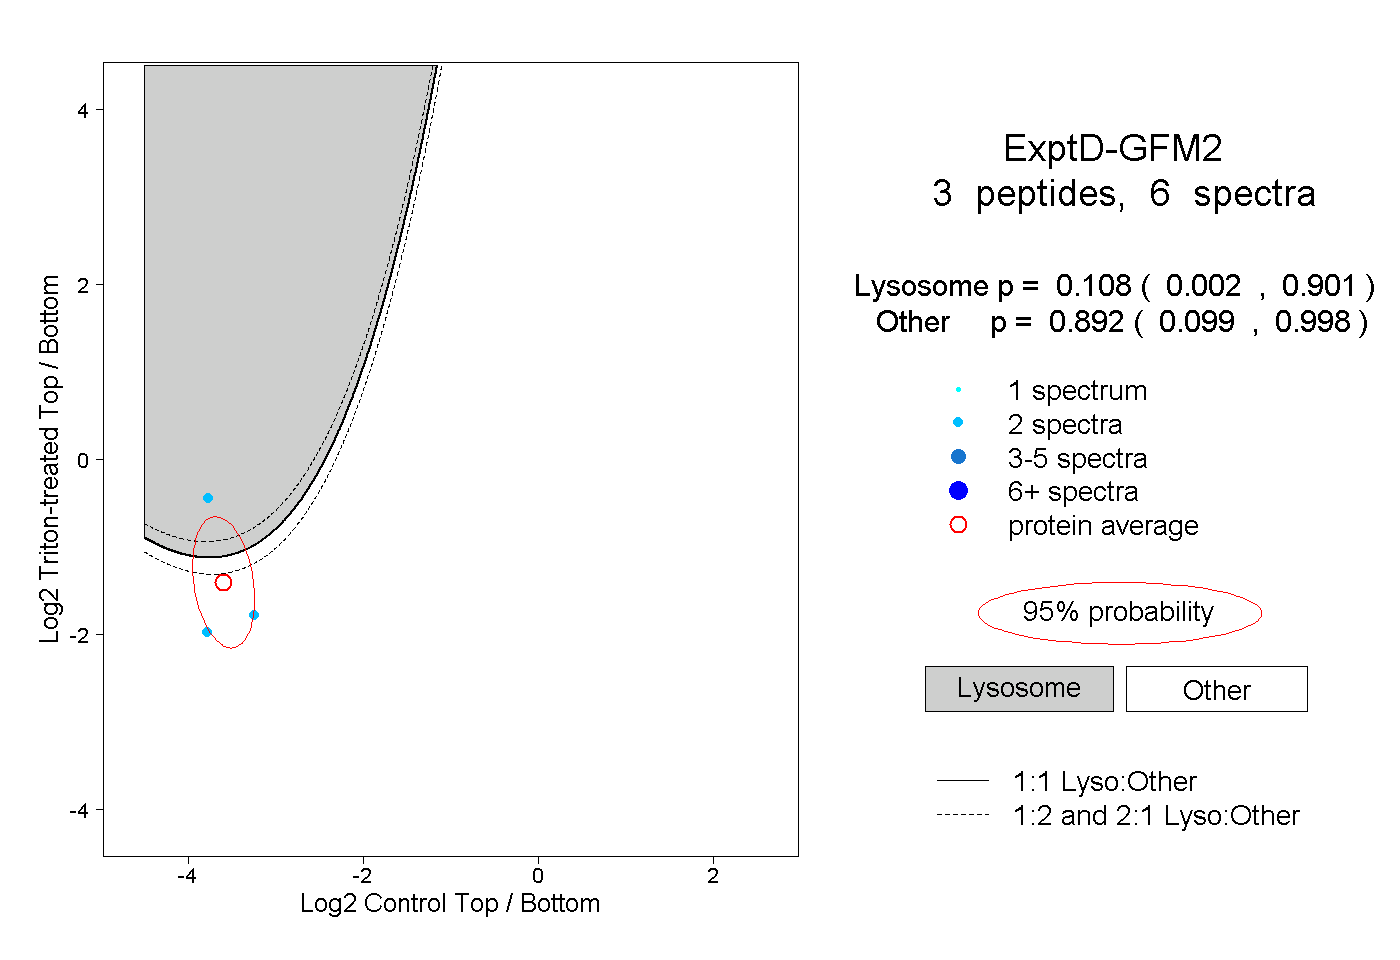 |
0.108 0.002 | 0.901 |
0.892 0.099 | 0.998 |