 2
2peptides
spectra
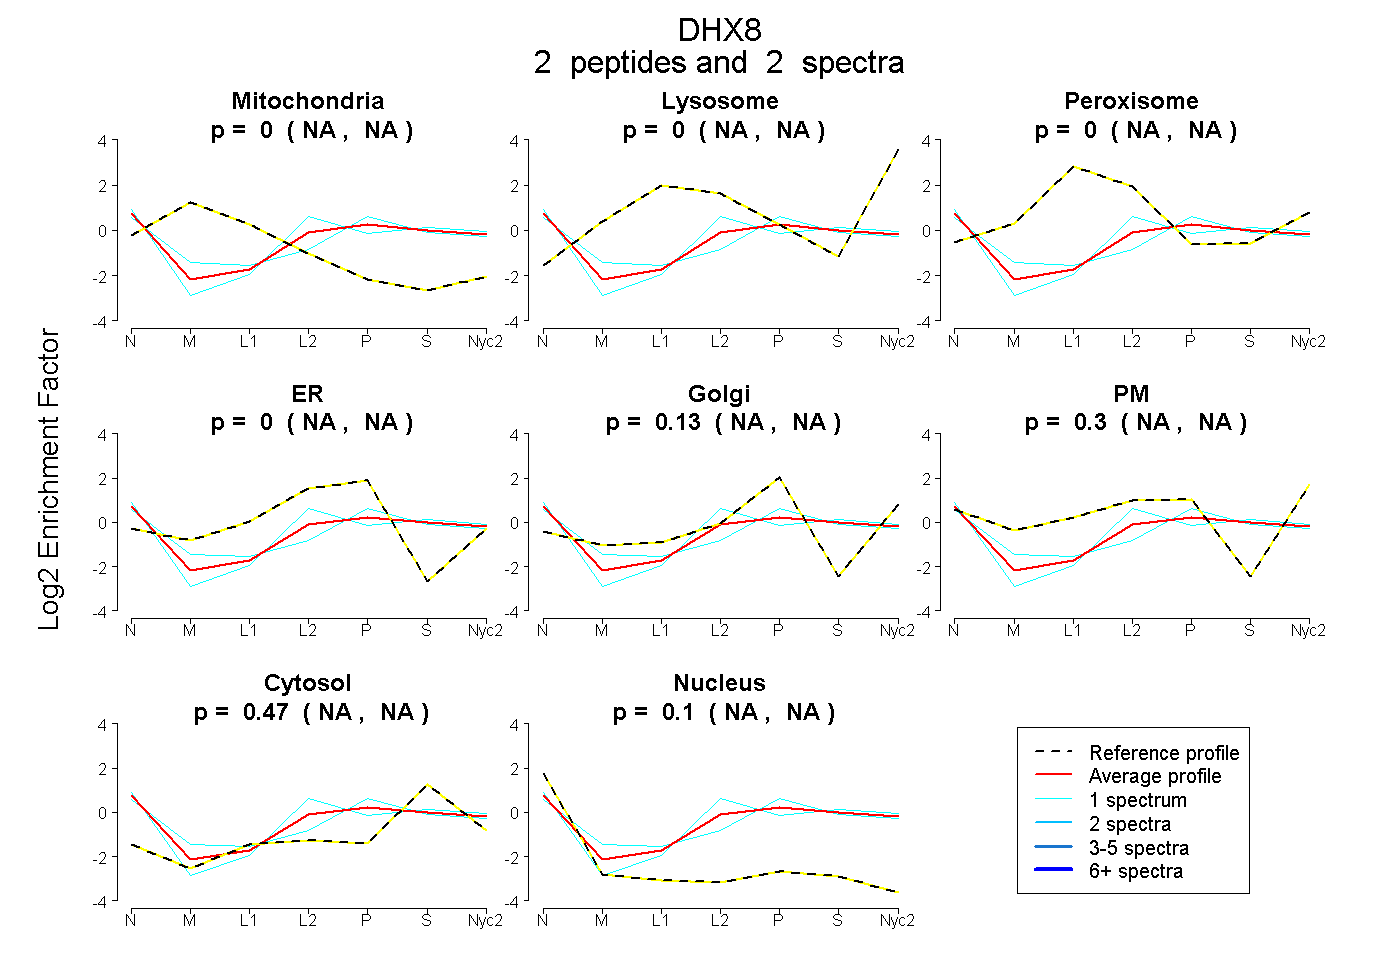
NA | NA
NA | NA
NA | NA
NA | NA
NA | NA
NA | NA
NA | NA
NA | NA
| Plot | Mito | Lyso | Perox | ER | Golgi | PM | Cytosol | Nucleus | |||||
| Expt A |
2 peptides |
2 spectra |
|
0.000 NA | NA |
0.000 NA | NA |
0.000 NA | NA |
0.002 NA | NA |
0.127 NA | NA |
0.297 NA | NA |
0.473 NA | NA |
0.101 NA | NA |
| 1 spectrum, DLAEFVISLAEK | 0.000 | 0.000 | 0.000 | 0.000 | 0.339 | 0.148 | 0.415 | 0.098 | ||
| 1 spectrum, DVDQETGEDLNPNR | 0.000 | 0.000 | 0.000 | 0.062 | 0.000 | 0.323 | 0.518 | 0.096 |
| Plot | Lyso | Other | |||||||||||
| Expt C |
2 peptides |
12 spectra |
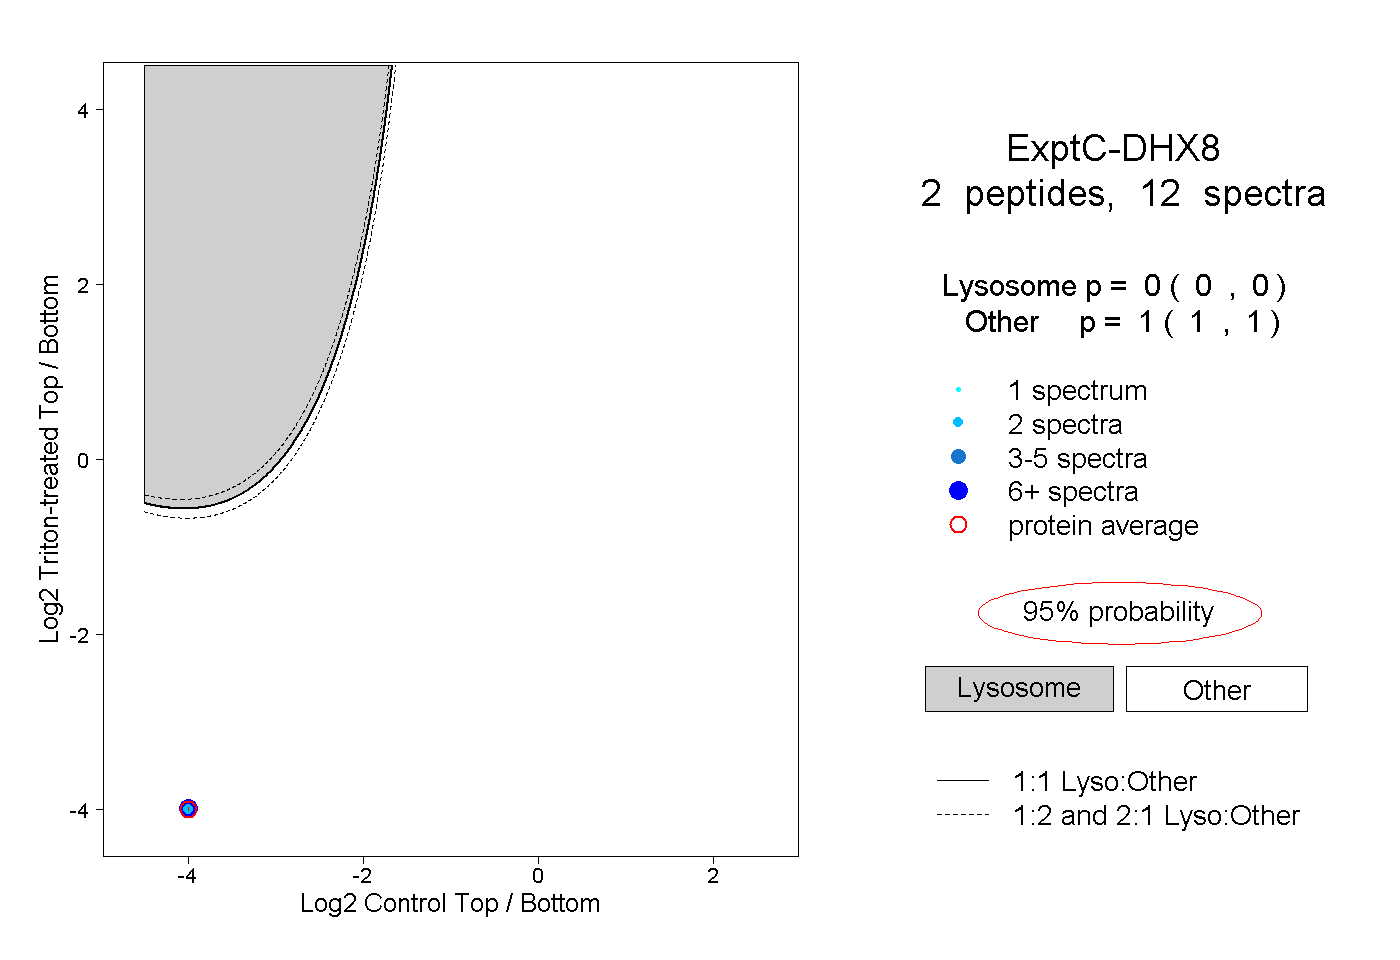 |
0.000 0.000 | 0.000 |
1.000 1.000 | 1.000 |