 2
2peptides
spectra
0.457 | 0.588
0.000 | 0.030
0.000 | 0.000
0.000 | 0.000
0.089 | 0.341
0.000 | 0.311
0.000 | 0.007
0.021 | 0.108
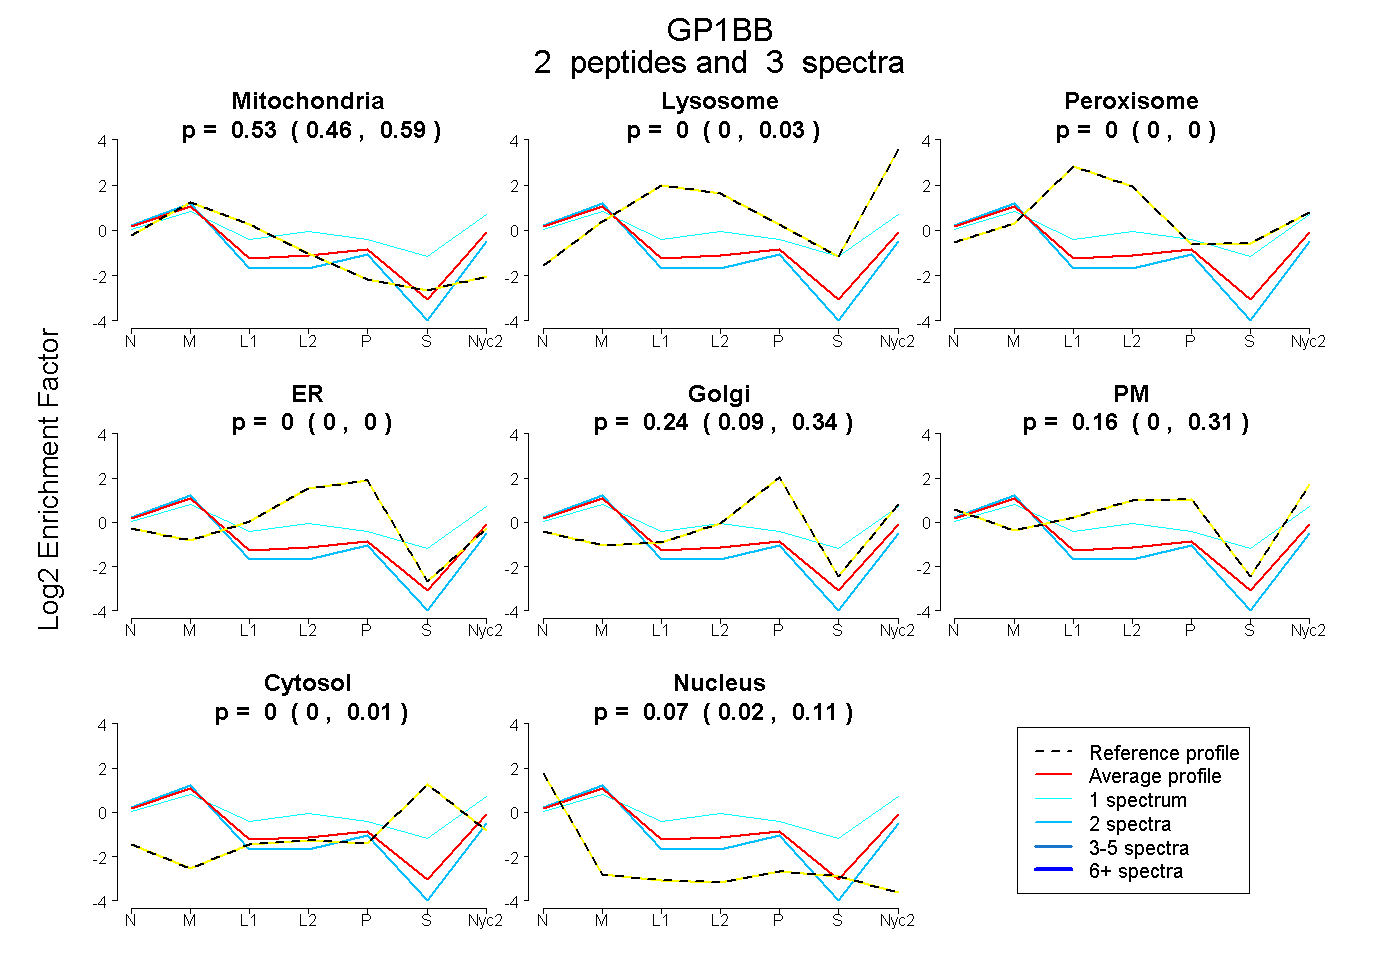
| Plot | Mito | Lyso | Perox | ER | Golgi | PM | Cytosol | Nucleus | |||||
| Expt A |
2 peptides |
3 spectra |
|
0.532 0.457 | 0.588 |
0.000 0.000 | 0.030 |
0.000 0.000 | 0.000 |
0.000 0.000 | 0.000 |
0.237 0.089 | 0.341 |
0.161 0.000 | 0.311 |
0.000 0.000 | 0.007 |
0.071 0.021 | 0.108 |
| 2 spectra, LLPYVAEDELR | 0.576 | 0.000 | 0.000 | 0.000 | 0.294 | 0.000 | 0.000 | 0.131 | ||
| 1 spectrum, VHLGANPWR | 0.314 | 0.149 | 0.000 | 0.000 | 0.000 | 0.383 | 0.154 | 0.000 |