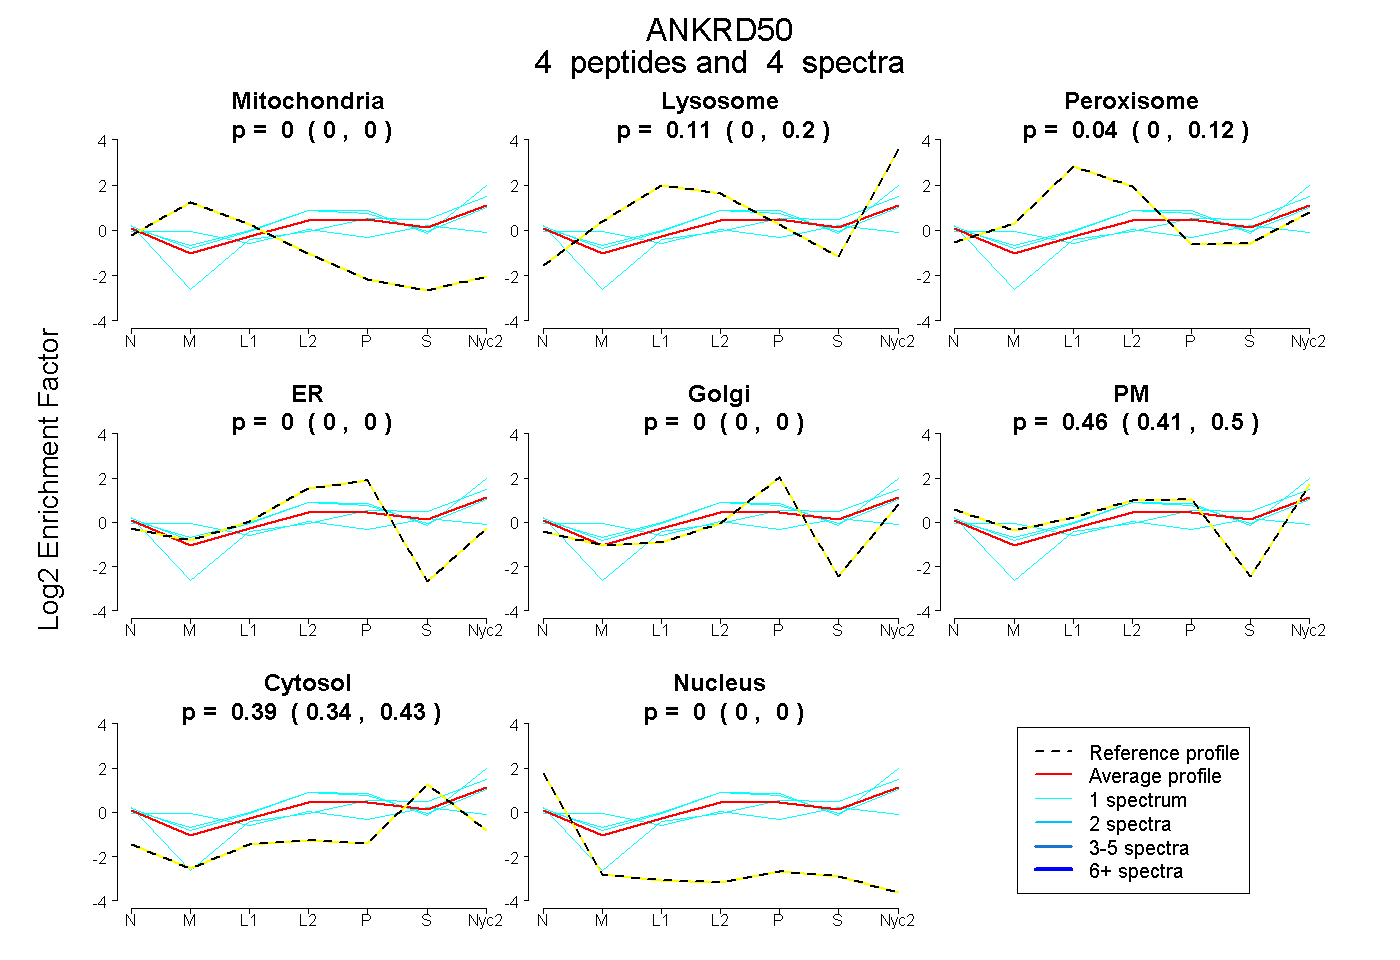
 4
4peptides
spectra
0.000 | 0.000
0.000 | 0.196
0.000 | 0.121
0.000 | 0.000
0.000 | 0.000
0.410 | 0.501
0.342 | 0.425
0.000 | 0.000
| Plot | Mito | Lyso | Perox | ER | Golgi | PM | Cytosol | Nucleus | |||||
| Expt A |
4 peptides |
4 spectra |
|
0.000 0.000 | 0.000 |
0.111 0.000 | 0.196 |
0.036 0.000 | 0.121 |
0.000 0.000 | 0.000 |
0.000 0.000 | 0.000 |
0.463 0.410 | 0.501 |
0.390 0.342 | 0.425 |
0.000 0.000 | 0.000 |
| 1 spectrum, MFTGFR | 0.000 | 0.281 | 0.000 | 0.000 | 0.000 | 0.470 | 0.249 | 0.000 | ||
| 1 spectrum, EQEVLQLLIR | 0.000 | 0.073 | 0.000 | 0.000 | 0.000 | 0.422 | 0.505 | 0.000 | ||
| 1 spectrum, GADLEIEDTHGHTPLTLAAR | 0.128 | 0.000 | 0.149 | 0.000 | 0.000 | 0.297 | 0.425 | 0.000 | ||
| 1 spectrum, GLDESHR | 0.000 | 0.054 | 0.131 | 0.008 | 0.000 | 0.510 | 0.297 | 0.000 |
| Plot | Lyso | Other | |||||||||||
| Expt C |
5 peptides |
7 spectra |
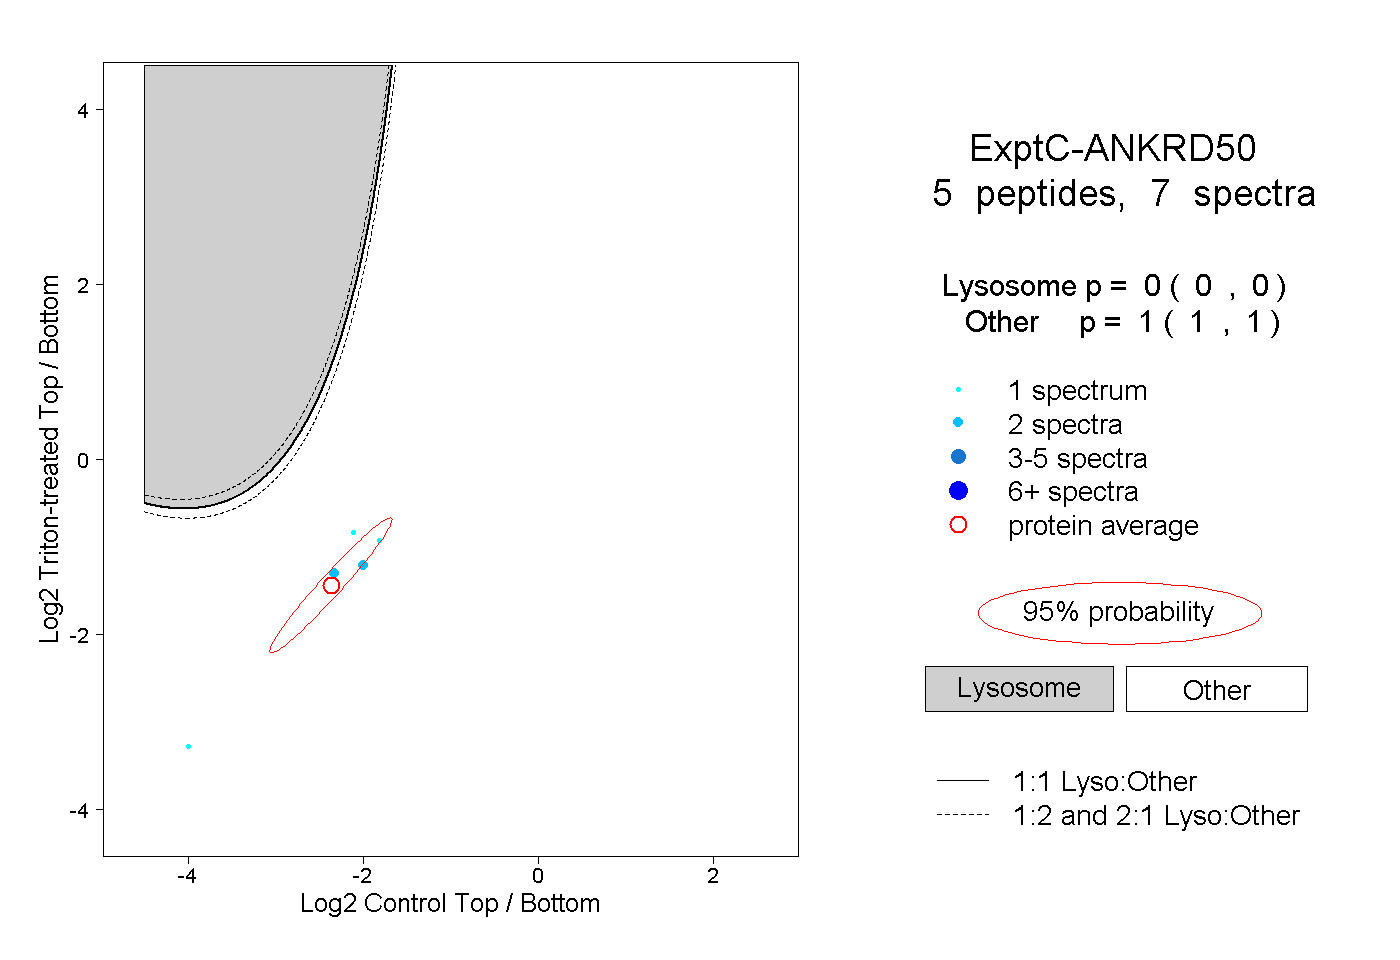 |
0.000 0.000 | 0.000 |
1.000 1.000 | 1.000 |