 4
4peptides
spectra
0.000 | 0.000
0.000 | 0.196
0.000 | 0.121
0.000 | 0.000
0.000 | 0.000
0.410 | 0.501
0.342 | 0.425
0.000 | 0.000
5peptides
spectra
0.000 | 0.000
1.000 | 1.000
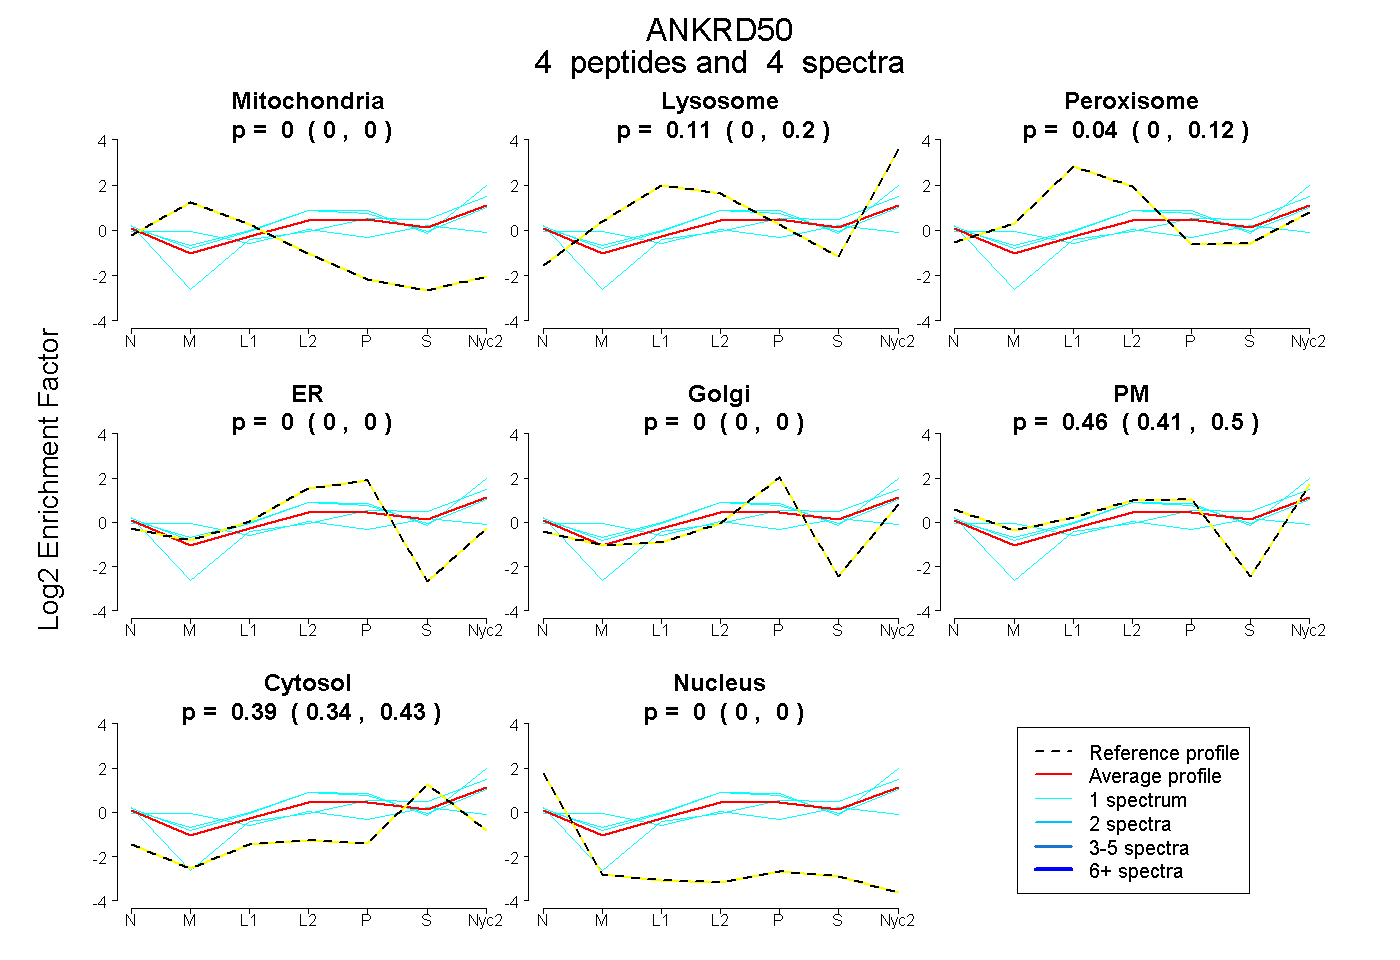
| Plot | Mito | Lyso | Perox | ER | Golgi | PM | Cytosol | Nucleus | |||||
| Expt A |
4 peptides |
4 spectra |
|
0.000 0.000 | 0.000 |
0.111 0.000 | 0.196 |
0.036 0.000 | 0.121 |
0.000 0.000 | 0.000 |
0.000 0.000 | 0.000 |
0.463 0.410 | 0.501 |
0.390 0.342 | 0.425 |
0.000 0.000 | 0.000 |
||
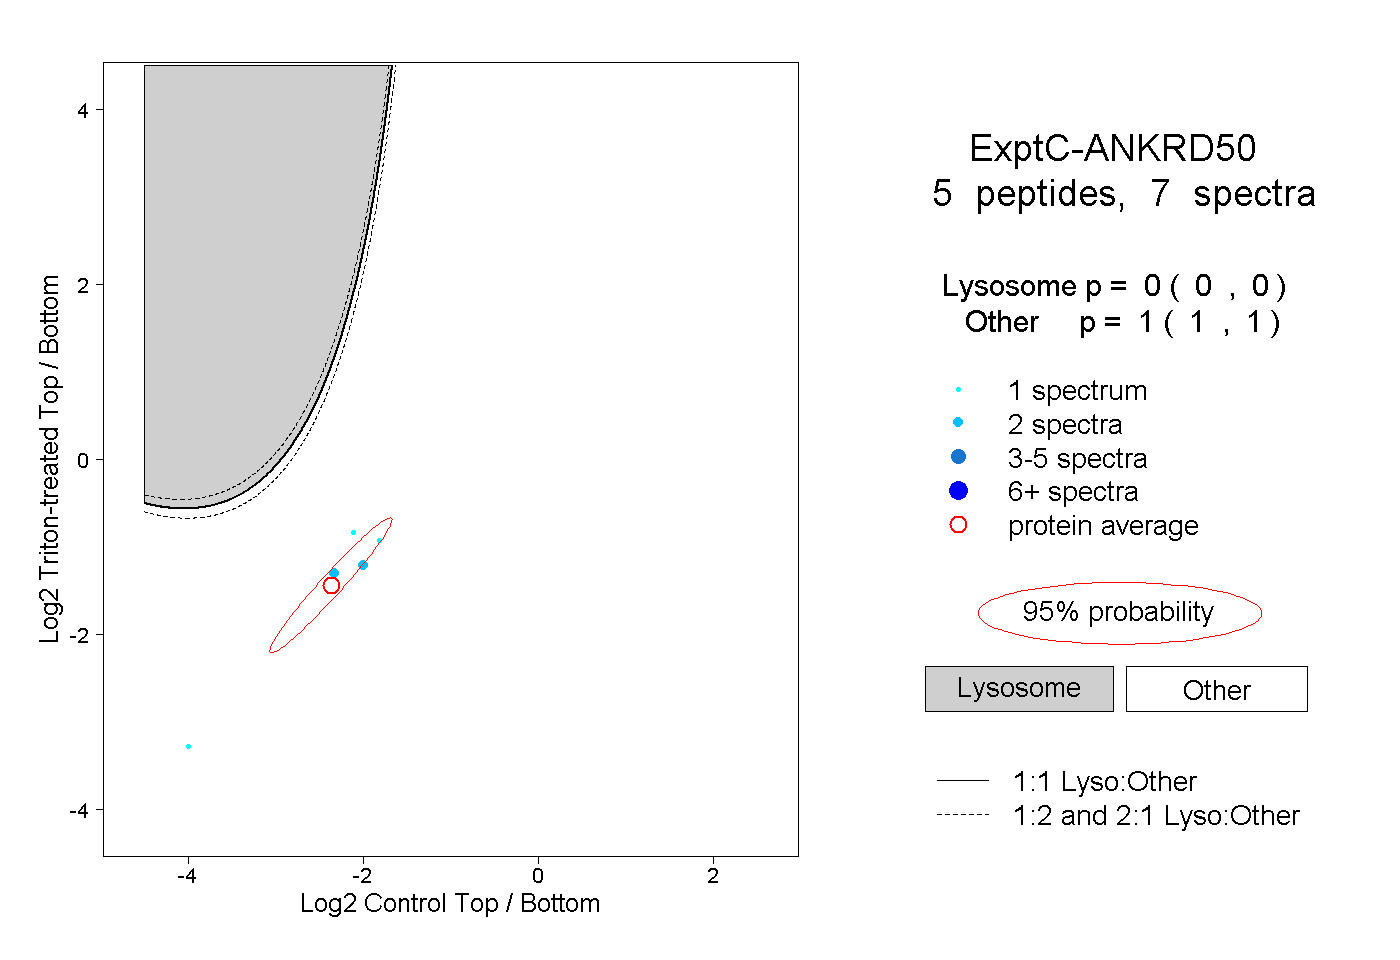
| Plot | Lyso | Other | |||||||||||
| Expt C |
5 peptides |
7 spectra |
|
0.000 0.000 | 0.000 |
1.000 1.000 | 1.000 |