 9
9peptides
spectra
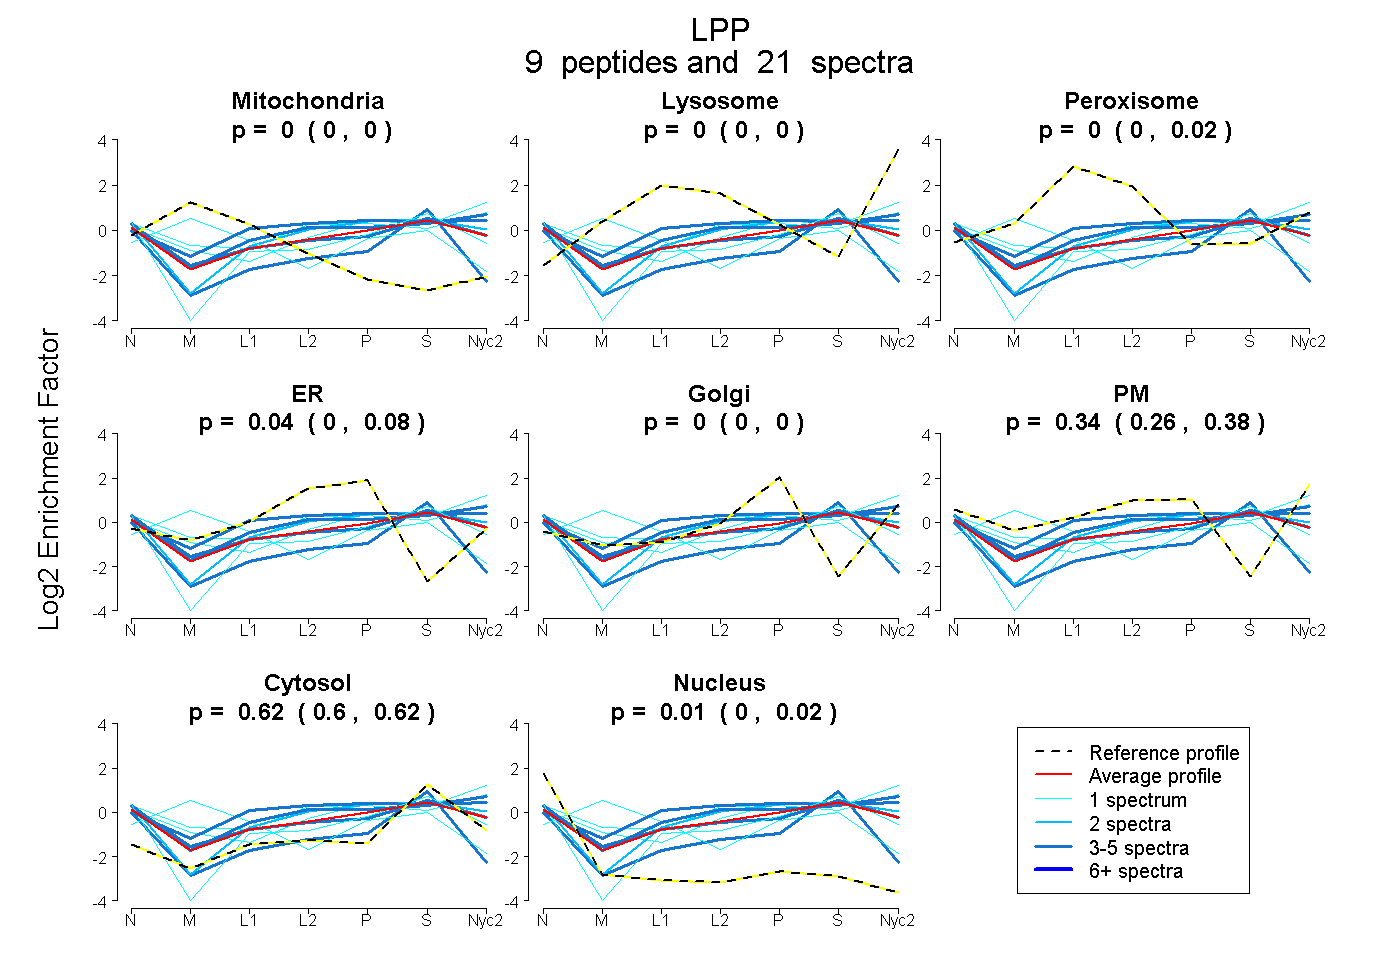
0.000 | 0.000
0.000 | 0.000
0.000 | 0.021
0.000 | 0.082
0.000 | 0.000
0.264 | 0.378
0.600 | 0.625
0.000 | 0.024
| Plot | Mito | Lyso | Perox | ER | Golgi | PM | Cytosol | Nucleus | |||||
| Expt A |
9 peptides |
21 spectra |
|
0.000 0.000 | 0.000 |
0.000 0.000 | 0.000 |
0.000 0.000 | 0.021 |
0.036 0.000 | 0.082 |
0.000 0.000 | 0.000 |
0.337 0.264 | 0.378 |
0.617 0.600 | 0.625 |
0.010 0.000 | 0.024 |
| 4 spectra, MVIPQQPPLTATK | 0.000 | 0.000 | 0.229 | 0.000 | 0.054 | 0.302 | 0.416 | 0.000 | ||
| 1 spectrum, FAPVVAPKPK | 0.000 | 0.000 | 0.028 | 0.000 | 0.000 | 0.556 | 0.416 | 0.000 | ||
| 2 spectra, GNPGGK | 0.000 | 0.000 | 0.000 | 0.117 | 0.000 | 0.283 | 0.600 | 0.000 | ||
| 3 spectra, SHPSWLPPR | 0.000 | 0.000 | 0.045 | 0.000 | 0.000 | 0.461 | 0.494 | 0.000 | ||
| 1 spectrum, YFEPFFAACPSYGGR | 0.000 | 0.000 | 0.000 | 0.050 | 0.046 | 0.091 | 0.737 | 0.076 | ||
| 1 spectrum, AYHPHCFTCVMCHR | 0.000 | 0.012 | 0.000 | 0.000 | 0.044 | 0.472 | 0.472 | 0.000 | ||
| 4 spectra, DFHVHCYR | 0.000 | 0.000 | 0.000 | 0.034 | 0.000 | 0.000 | 0.740 | 0.226 | ||
| 1 spectrum, MLYDMENPPADDYFGR | 0.499 | 0.000 | 0.000 | 0.000 | 0.097 | 0.000 | 0.405 | 0.000 | ||
| 4 spectra, GQPFYAVEK | 0.000 | 0.000 | 0.044 | 0.000 | 0.000 | 0.320 | 0.601 | 0.034 |
| Plot | Lyso | Other | |||||||||||
| Expt C |
5 peptides |
33 spectra |
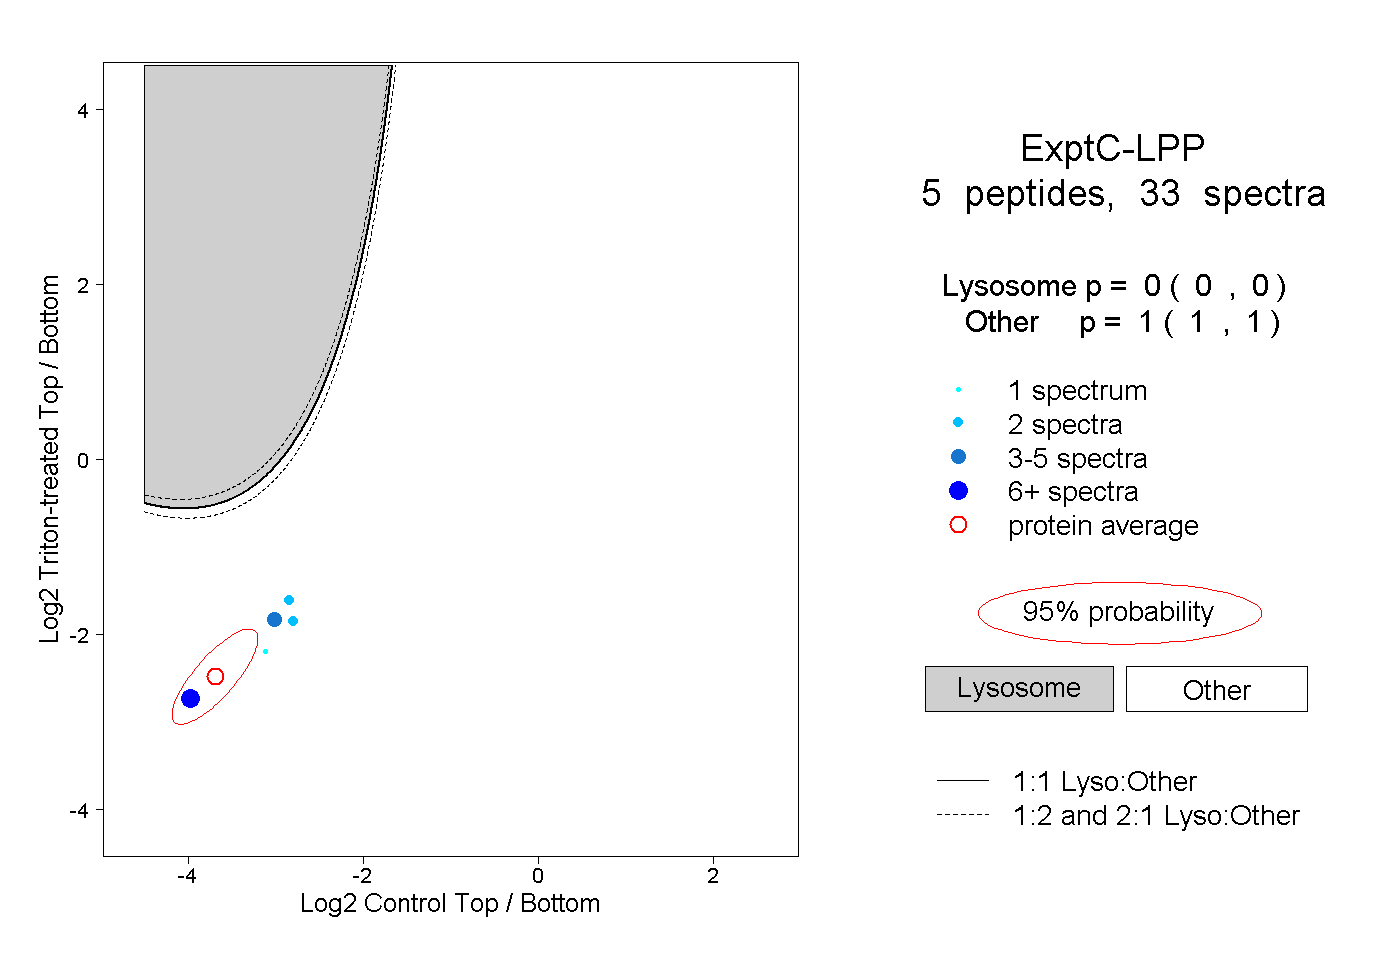 |
0.000 0.000 | 0.000 |
1.000 1.000 | 1.000 |