 3
3peptides
spectra
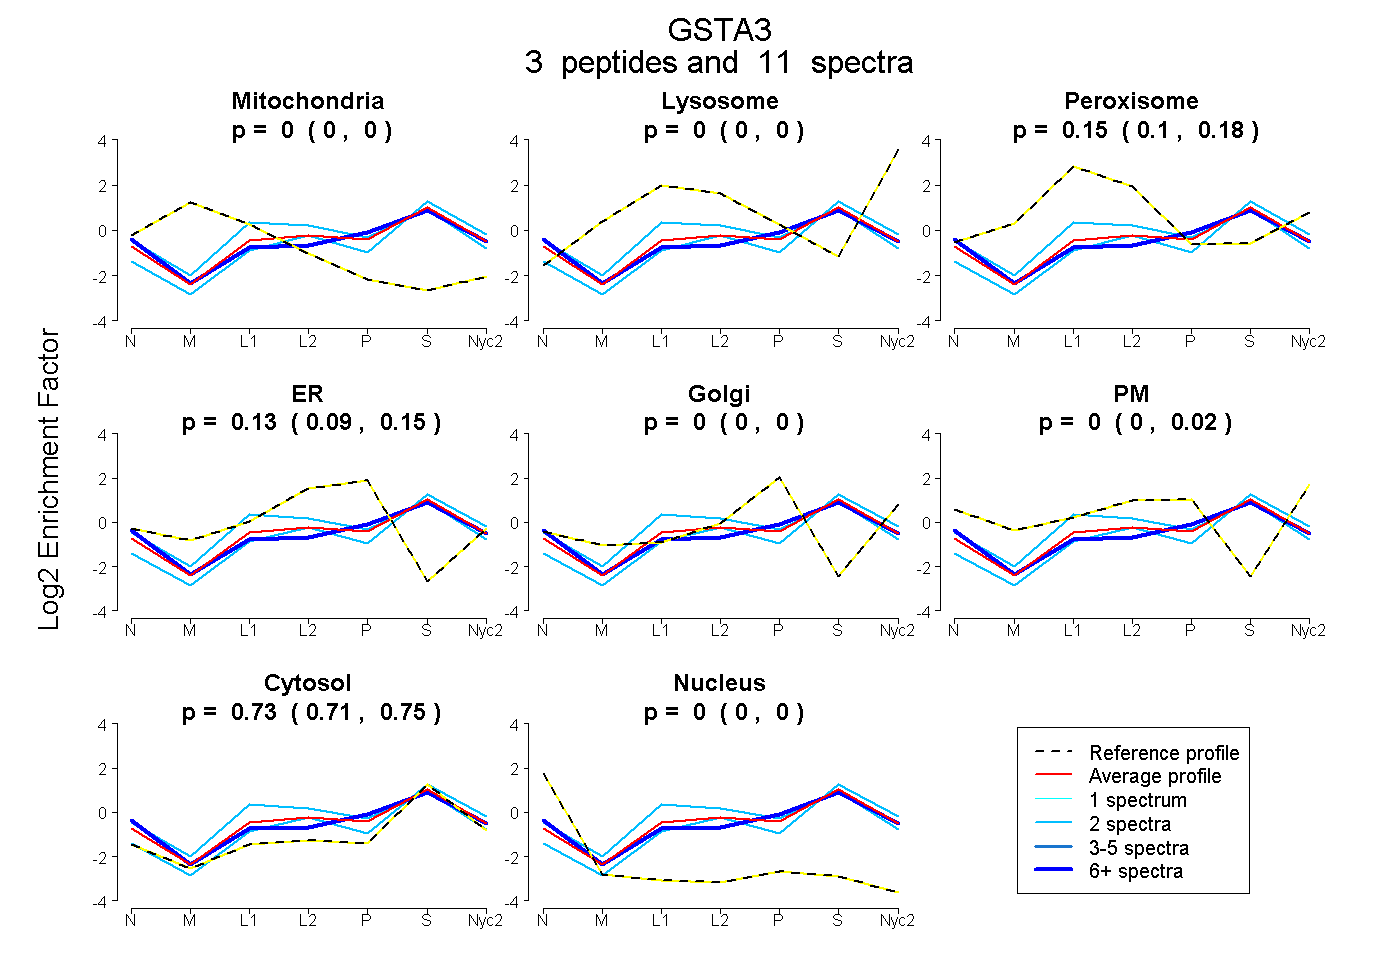
0.000 | 0.000
0.000 | 0.000
0.101 | 0.181
0.089 | 0.152
0.000 | 0.000
0.000 | 0.021
0.706 | 0.750
0.000 | 0.000
1peptide
spectra
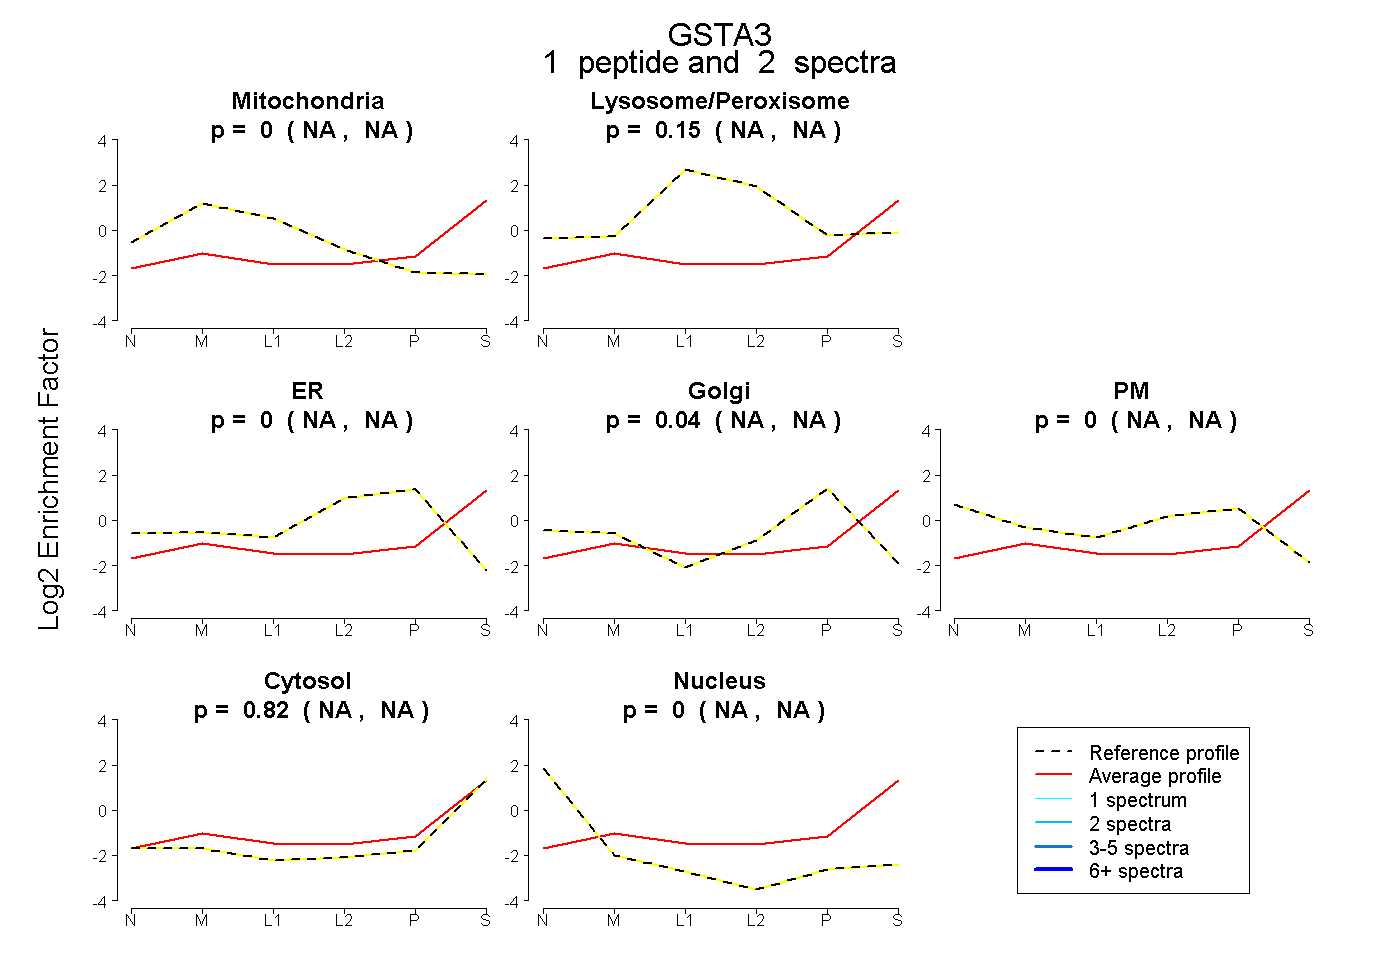
NA | NA
NA | NA
NA | NA
NA | NA
NA | NA
NA | NA
NA | NA
4peptides
spectra
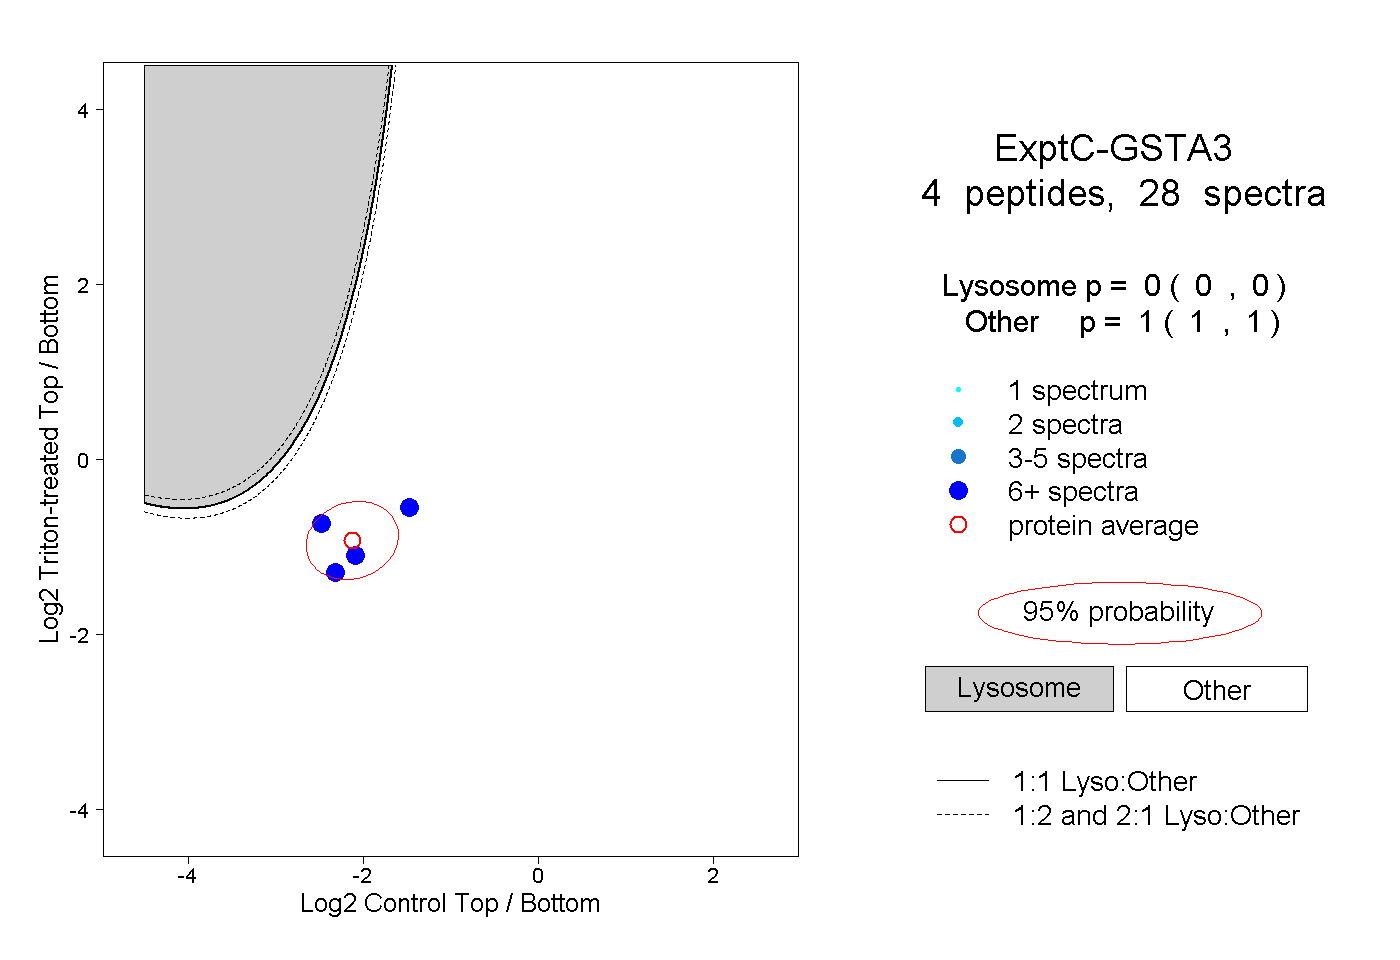
0.000 | 0.000
1.000 | 1.000
2peptides
spectra
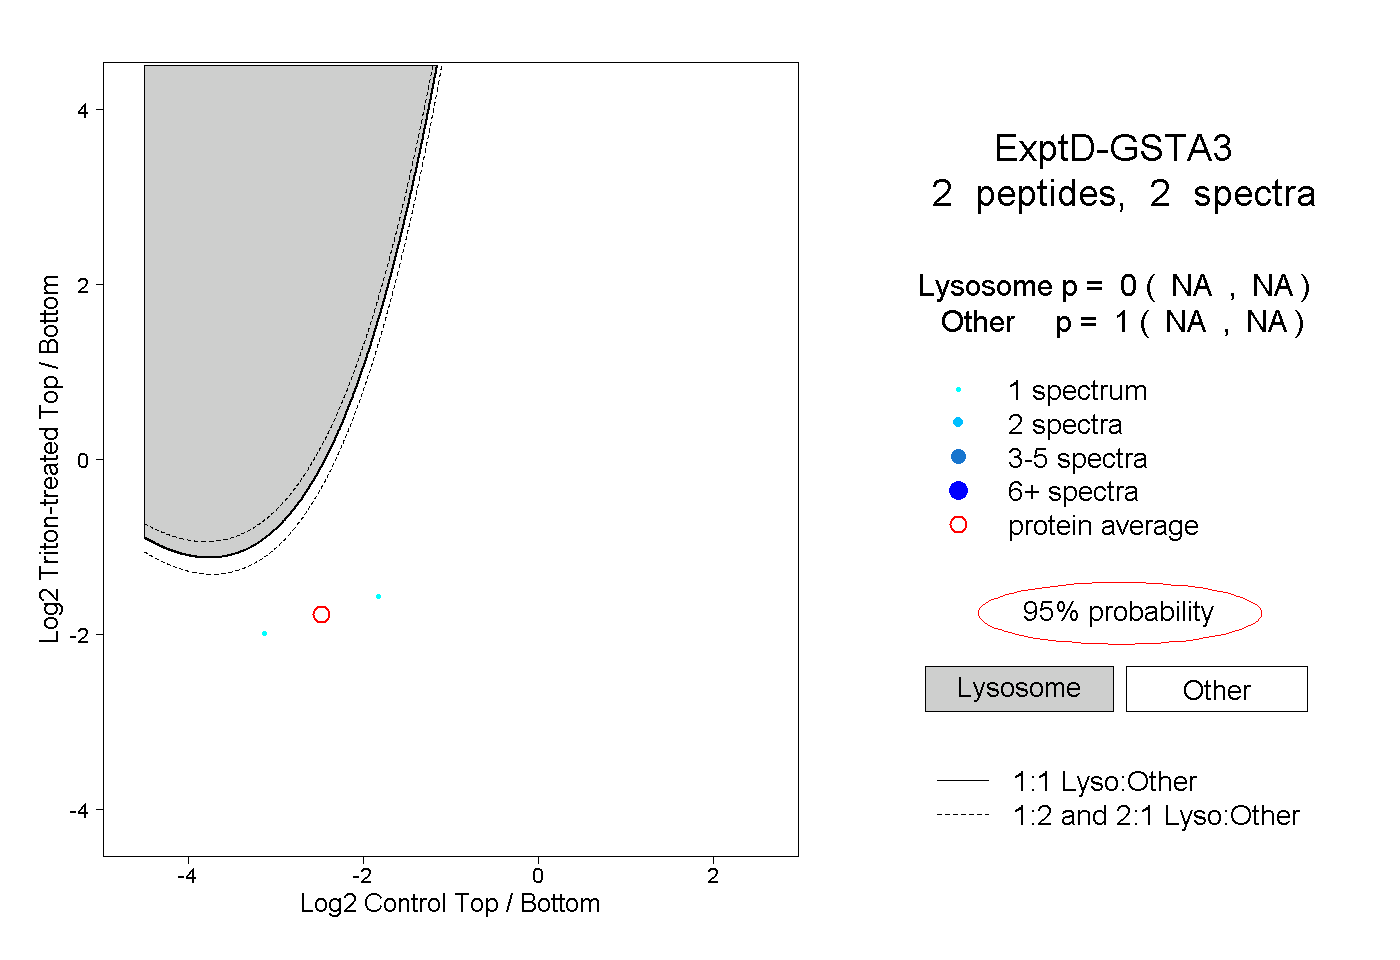
NA | NA
NA | NA