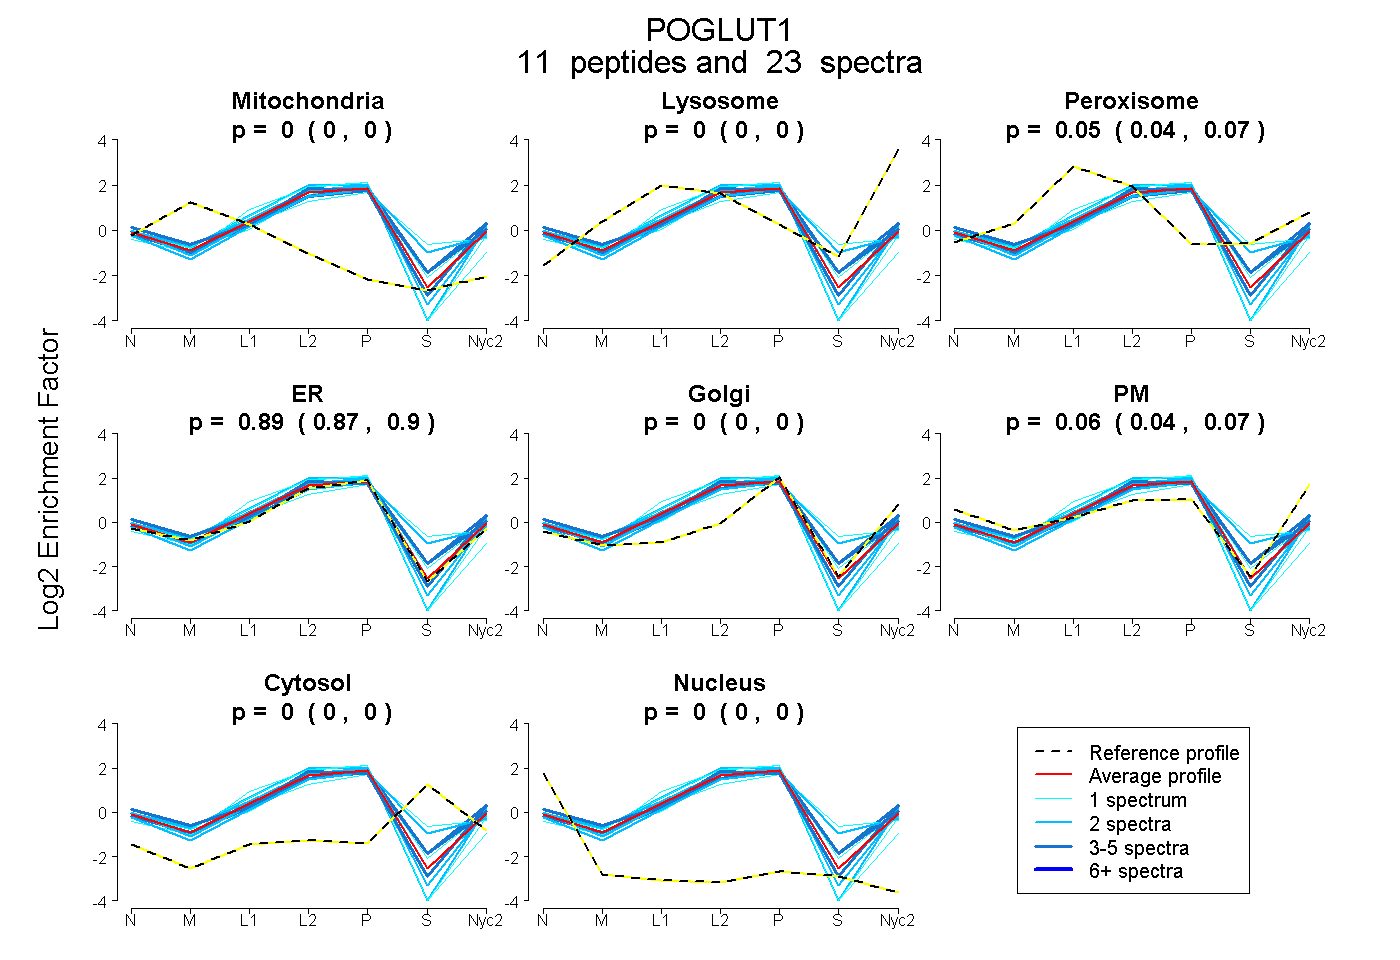
 11
11peptides
spectra
0.000 | 0.000
0.000 | 0.001
0.038 | 0.068
0.875 | 0.903
0.000 | 0.000
0.037 | 0.070
0.000 | 0.000
0.000 | 0.000
| Plot | Mito | Lyso | Perox | ER | Golgi | PM | Cytosol | Nucleus | |||||
| Expt A |
11 peptides |
23 spectra |
|
0.000 0.000 | 0.000 |
0.000 0.000 | 0.001 |
0.054 0.038 | 0.068 |
0.889 0.875 | 0.903 |
0.000 0.000 | 0.000 |
0.057 0.037 | 0.070 |
0.000 0.000 | 0.000 |
0.000 0.000 | 0.000 |
| 2 spectra, WMEPTIPVFSFSK | 0.000 | 0.000 | 0.092 | 0.741 | 0.000 | 0.000 | 0.167 | 0.000 | ||
| 2 spectra, SAAQWPWEK | 0.000 | 0.000 | 0.026 | 0.956 | 0.000 | 0.018 | 0.000 | 0.000 | ||
| 2 spectra, GVAASFR | 0.000 | 0.000 | 0.000 | 0.882 | 0.000 | 0.118 | 0.000 | 0.000 | ||
| 3 spectra, LVDAEYTK | 0.000 | 0.031 | 0.056 | 0.802 | 0.000 | 0.048 | 0.062 | 0.000 | ||
| 2 spectra, ANDDLAQEIAK | 0.000 | 0.000 | 0.000 | 0.899 | 0.000 | 0.101 | 0.000 | 0.000 | ||
| 1 spectrum, CSGVEHFILEVIR | 0.000 | 0.000 | 0.000 | 1.000 | 0.000 | 0.000 | 0.000 | 0.000 | ||
| 3 spectra, DYPQVPK | 0.000 | 0.033 | 0.093 | 0.710 | 0.052 | 0.089 | 0.022 | 0.000 | ||
| 5 spectra, YLFNFR | 0.000 | 0.000 | 0.000 | 0.747 | 0.000 | 0.253 | 0.000 | 0.000 | ||
| 1 spectrum, DVHLIDHCK | 0.000 | 0.000 | 0.000 | 1.000 | 0.000 | 0.000 | 0.000 | 0.000 | ||
| 1 spectrum, DYYQIIPR | 0.000 | 0.000 | 0.151 | 0.646 | 0.000 | 0.000 | 0.202 | 0.000 | ||
| 1 spectrum, DTLGKPAAK | 0.000 | 0.035 | 0.012 | 0.863 | 0.000 | 0.055 | 0.034 | 0.000 |
| Plot | Mito | Lyso or Perox | ER | Golgi | PM | Cytosol | Nucleus | ||||||
| Expt B |
2 peptides |
2 spectra |
 |
0.071 NA | NA |
0.229 NA | NA |
0.699 NA | NA |
0.000 NA | NA |
0.000 NA | NA |
0.000 NA | NA |
0.000 NA | NA |
|||
| Plot | Lyso | Other | |||||||||||
| Expt C |
8 peptides |
18 spectra |
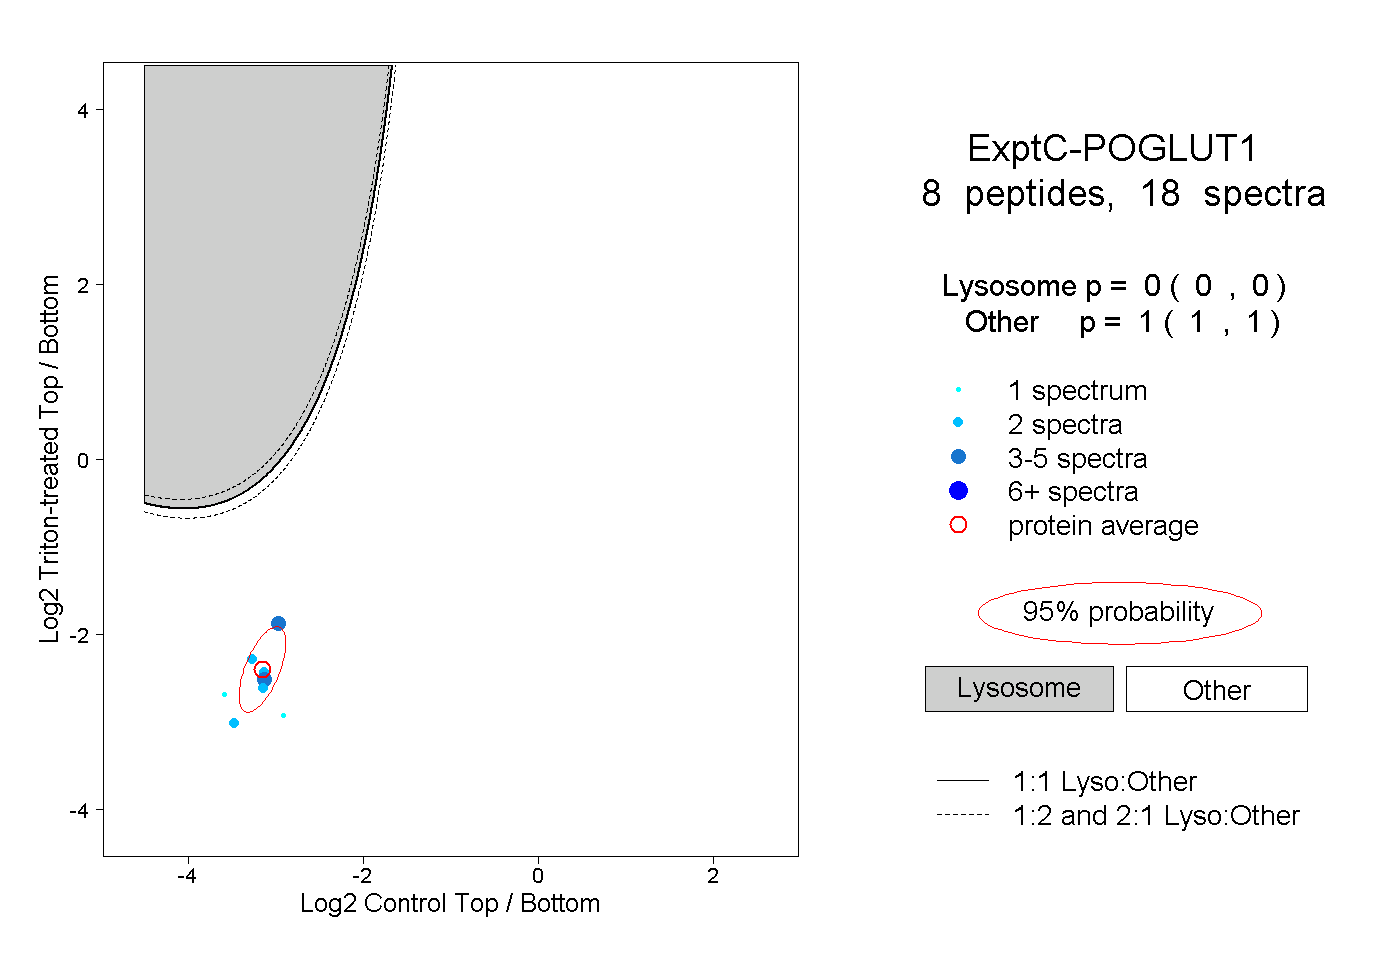 |
0.000 0.000 | 0.000 |
1.000 1.000 | 1.000 |
||||||||
| Plot | Lyso | Other | |||||||||||
| Expt D |
2 peptides |
2 spectra |
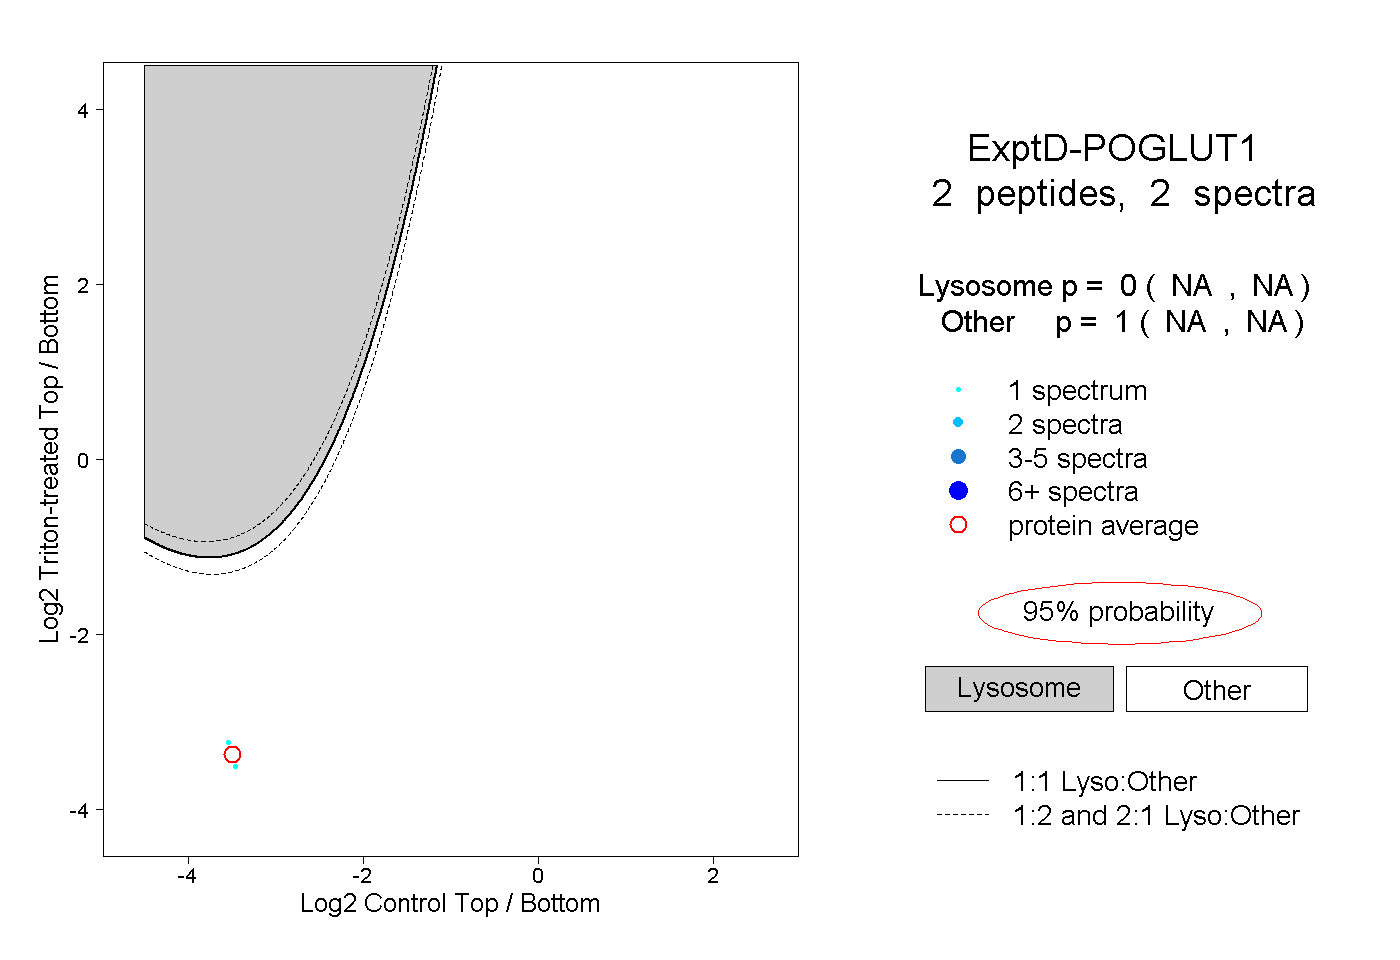 |
0.000 NA | NA |
1.000 NA | NA |