 7
7peptides
spectra
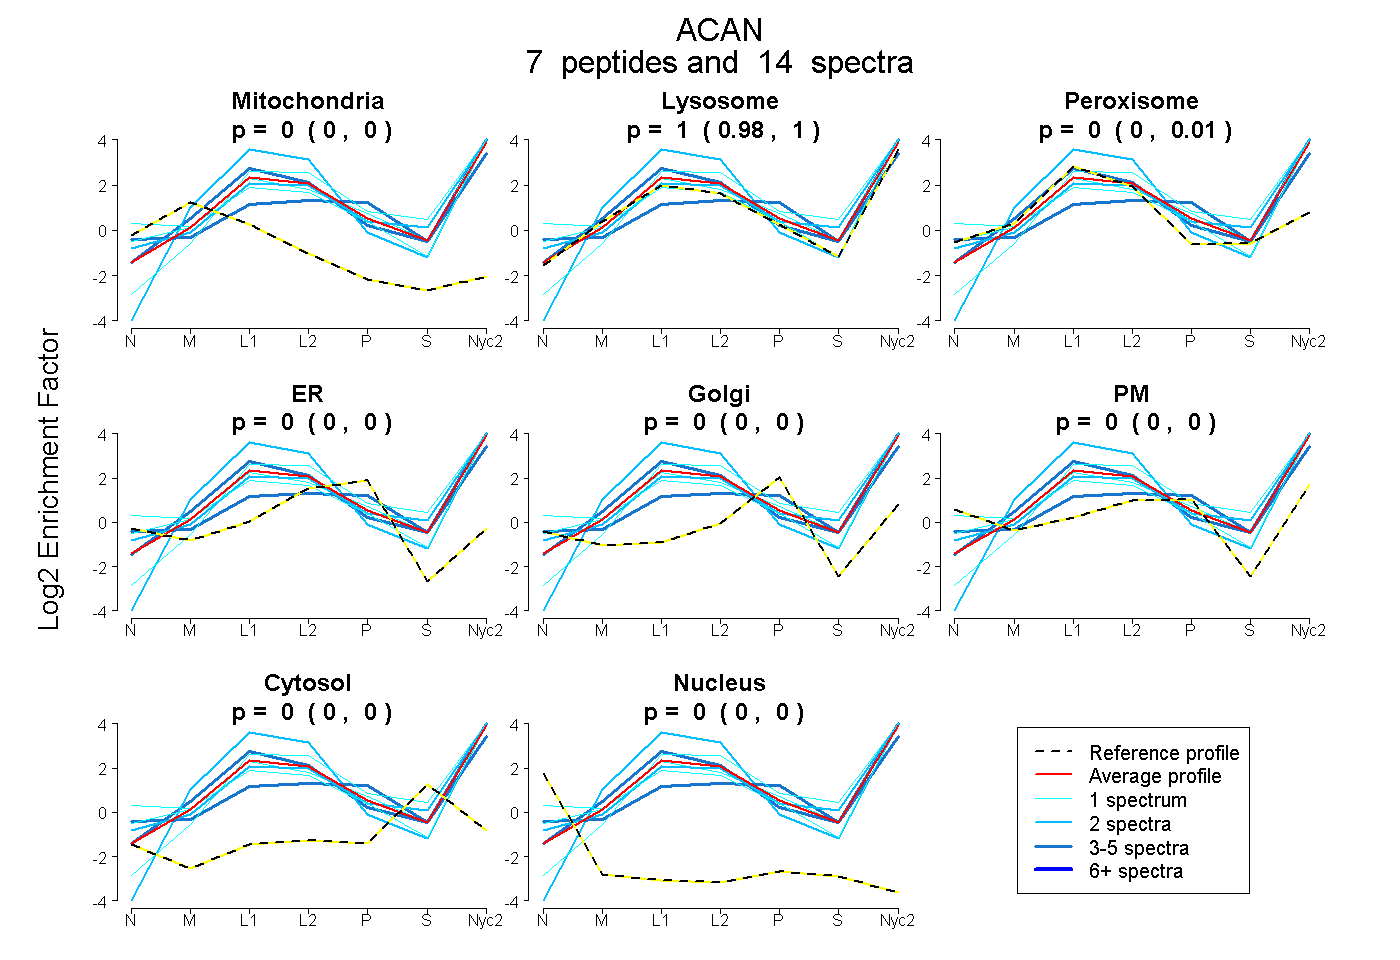
0.000 | 0.000
0.984 | 1.000
0.000 | 0.010
0.000 | 0.000
0.000 | 0.000
0.000 | 0.000
0.000 | 0.000
0.000 | 0.000
| Plot | Mito | Lyso | Perox | ER | Golgi | PM | Cytosol | Nucleus | |||||
| Expt A |
7 peptides |
14 spectra |
|
0.000 0.000 | 0.000 |
1.000 0.984 | 1.000 |
0.000 0.000 | 0.010 |
0.000 0.000 | 0.000 |
0.000 0.000 | 0.000 |
0.000 0.000 | 0.000 |
0.000 0.000 | 0.000 |
0.000 0.000 | 0.000 |
| 1 spectrum, NAQDYQWIGLNDR | 0.000 | 1.000 | 0.000 | 0.000 | 0.000 | 0.000 | 0.000 | 0.000 | ||
| 3 spectra, GIVFHYR | 0.000 | 0.686 | 0.000 | 0.000 | 0.059 | 0.218 | 0.036 | 0.000 | ||
| 2 spectra, FTFQEAANECR | 0.000 | 1.000 | 0.000 | 0.000 | 0.000 | 0.000 | 0.000 | 0.000 | ||
| 1 spectrum, YPIHTPR | 0.000 | 0.756 | 0.000 | 0.000 | 0.000 | 0.244 | 0.000 | 0.000 | ||
| 4 spectra, ARPNCGGNLLGVR | 0.000 | 0.991 | 0.009 | 0.000 | 0.000 | 0.000 | 0.000 | 0.000 | ||
| 1 spectrum, LPGGVVFHYRPGSTR | 0.000 | 0.970 | 0.001 | 0.000 | 0.000 | 0.029 | 0.000 | 0.000 | ||
| 2 spectra, TIEGDFR | 0.000 | 0.969 | 0.016 | 0.000 | 0.000 | 0.000 | 0.015 | 0.000 |
| Plot | Lyso | Other | |||||||||||
| Expt C |
5 peptides |
15 spectra |
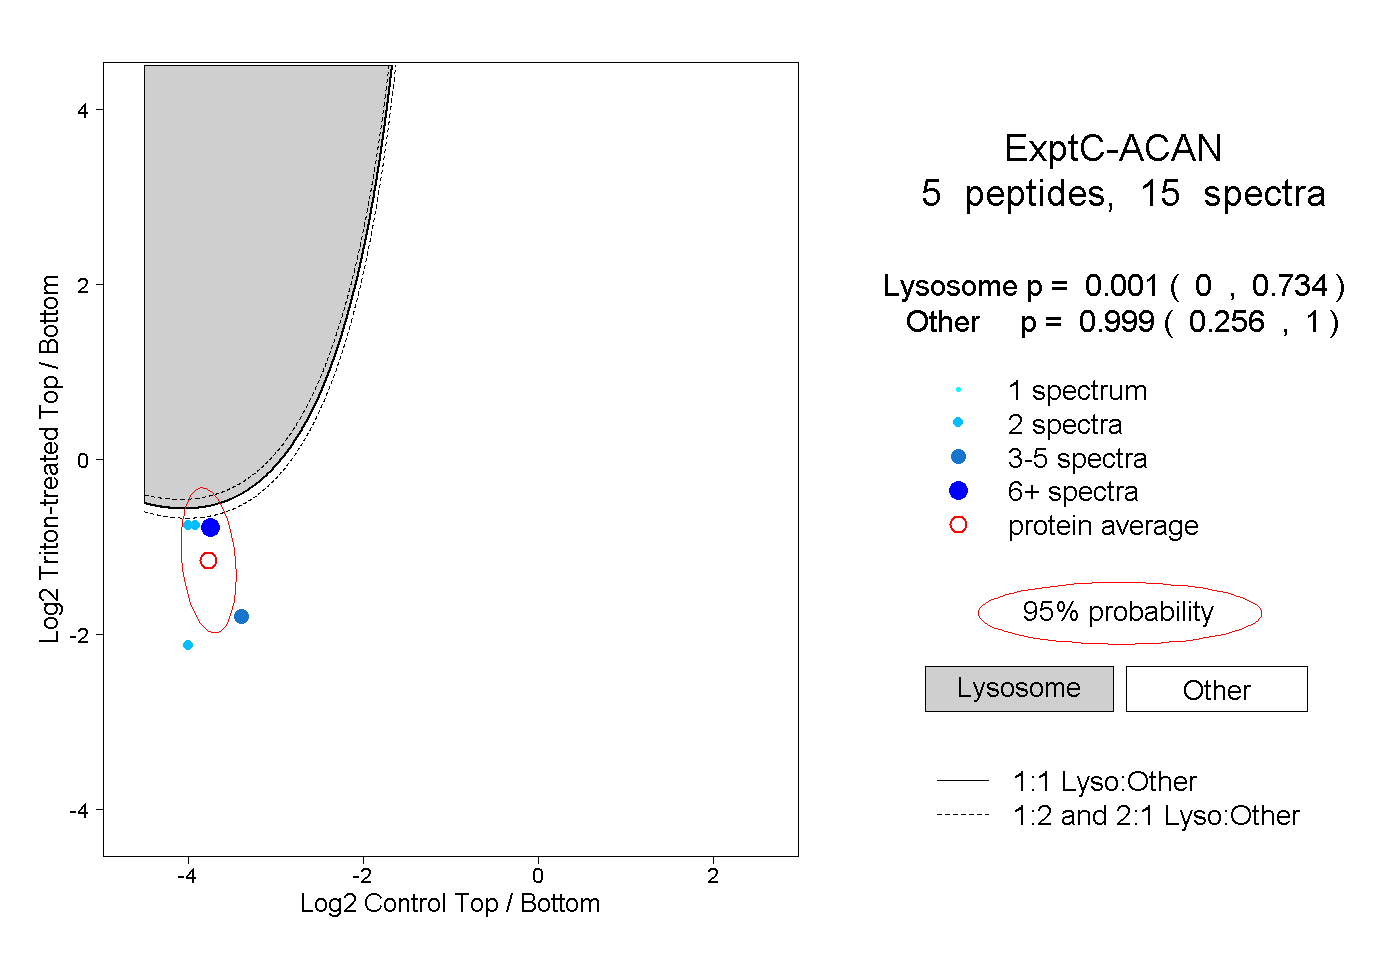 |
0.001 0.000 | 0.734 |
0.999 0.256 | 1.000 |
||||||||
| Plot | Lyso | Other | |||||||||||
| Expt D |
2 peptides |
3 spectra |
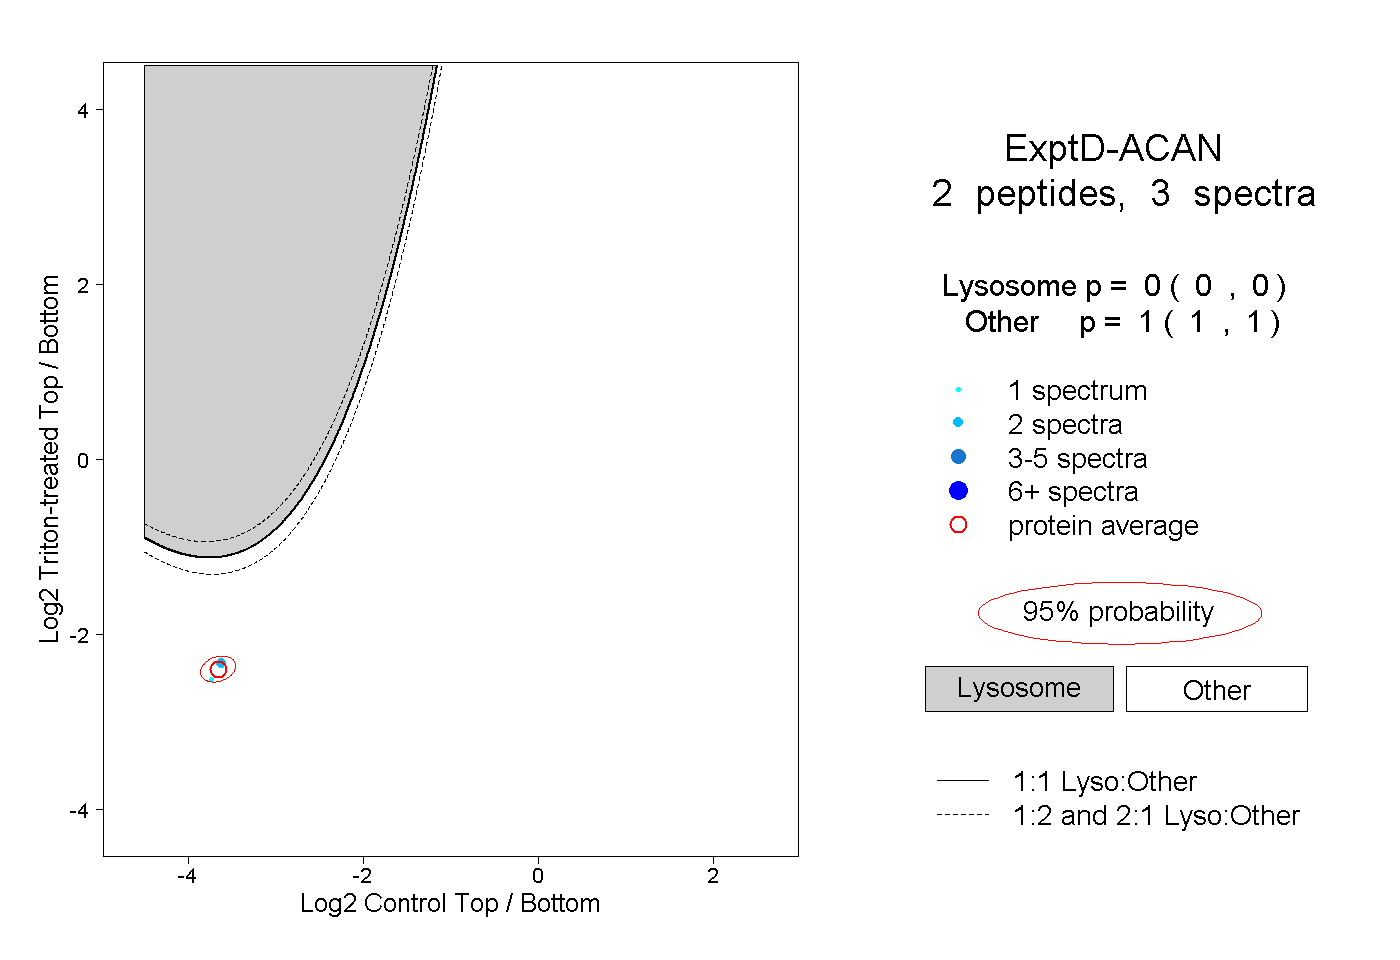 |
0.000 0.000 | 0.000 |
1.000 1.000 | 1.000 |