 7
7peptides
spectra
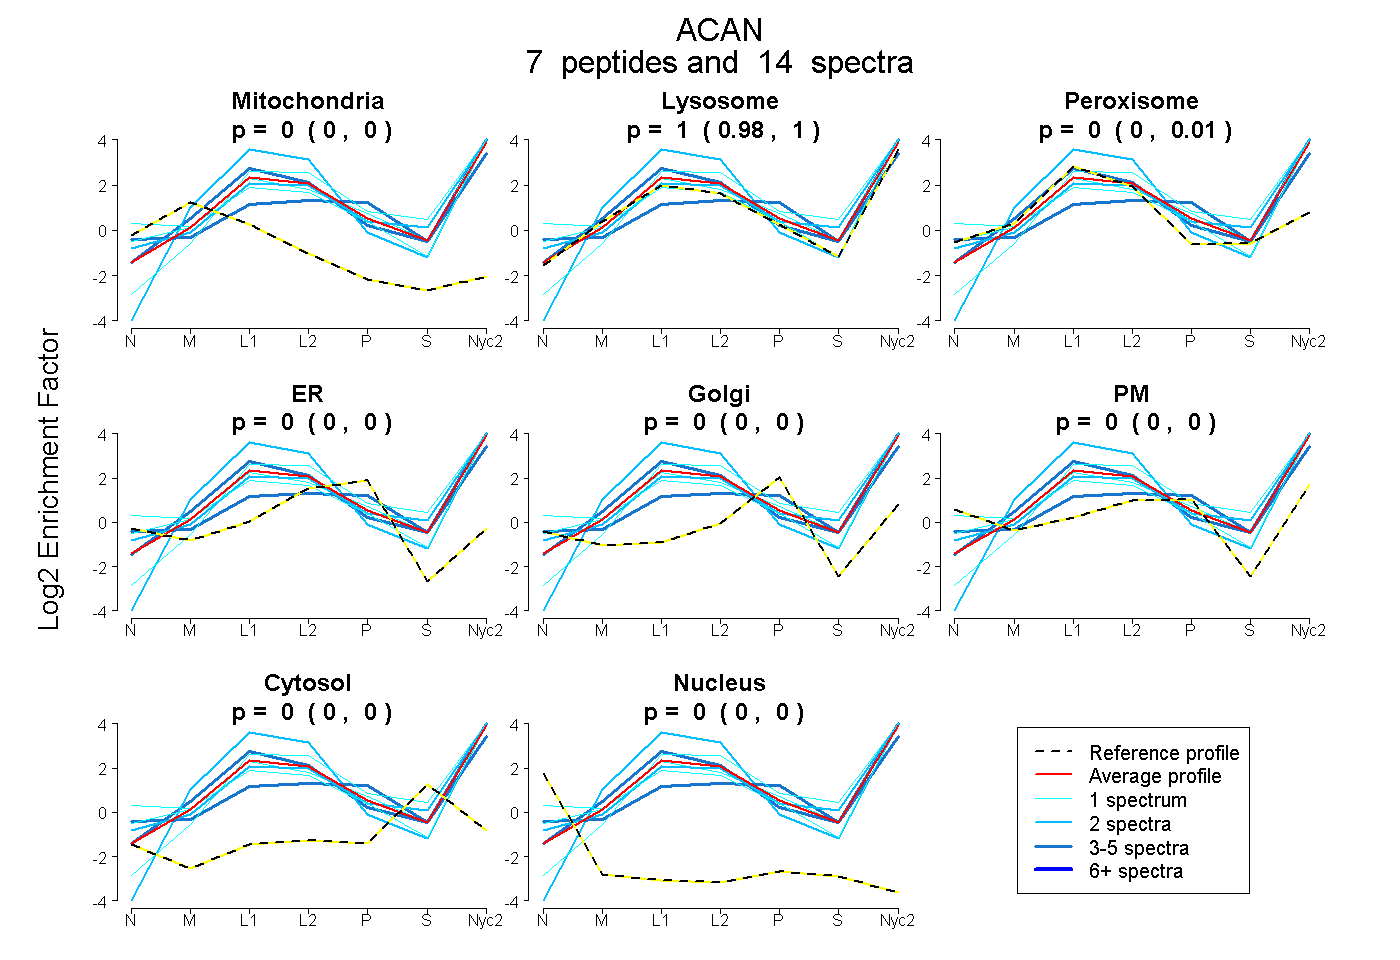
0.000 | 0.000
0.984 | 1.000
0.000 | 0.010
0.000 | 0.000
0.000 | 0.000
0.000 | 0.000
0.000 | 0.000
0.000 | 0.000
5peptides
spectra
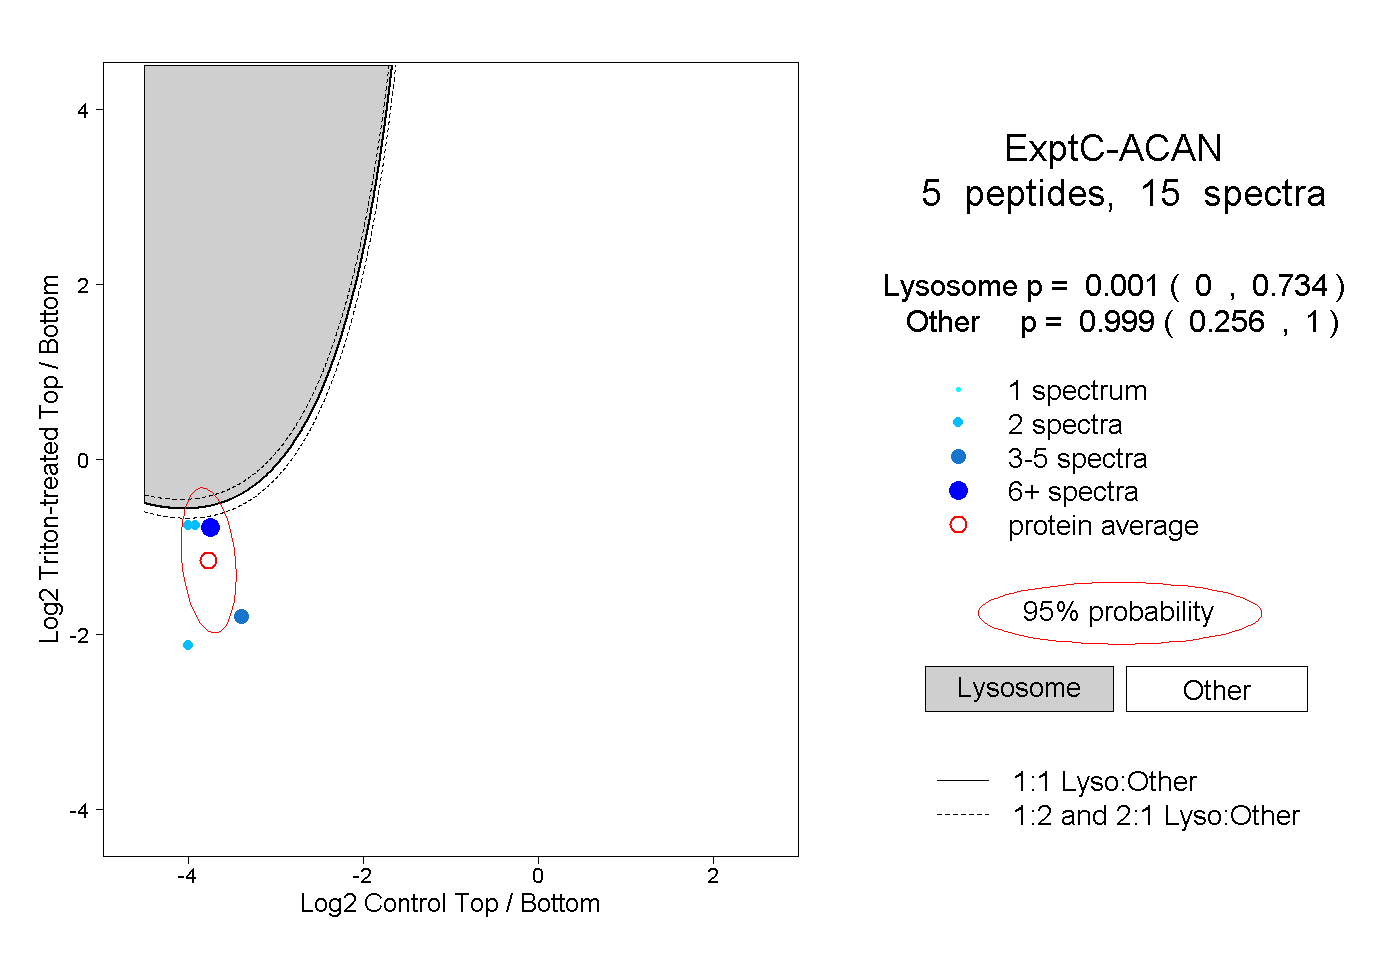
0.000 | 0.734
0.256 | 1.000
2peptides
spectra
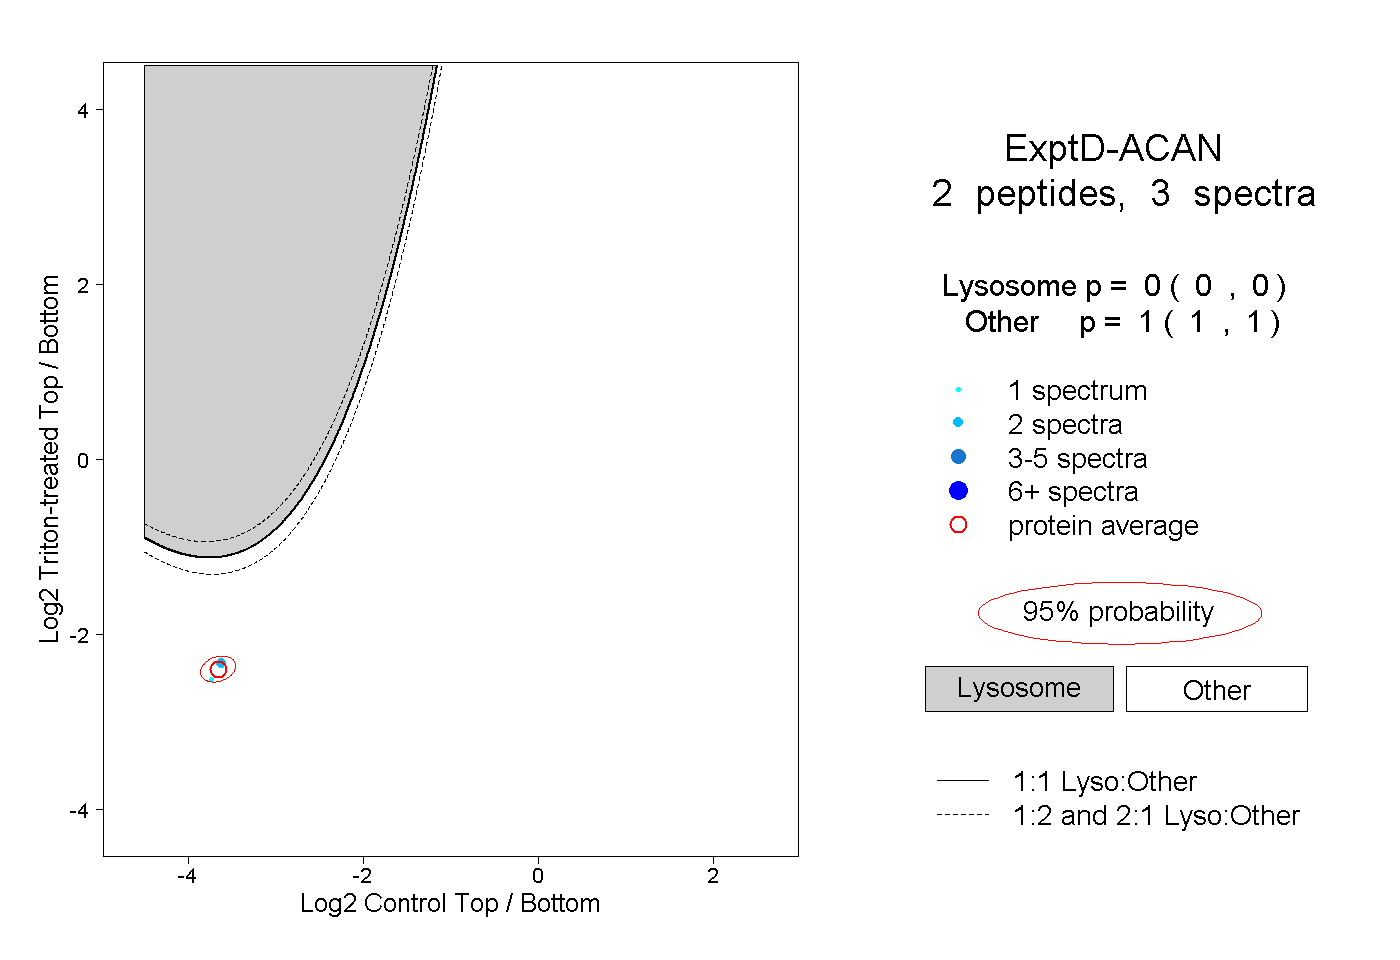
0.000 | 0.000
1.000 | 1.000