 1
1peptide
spectra
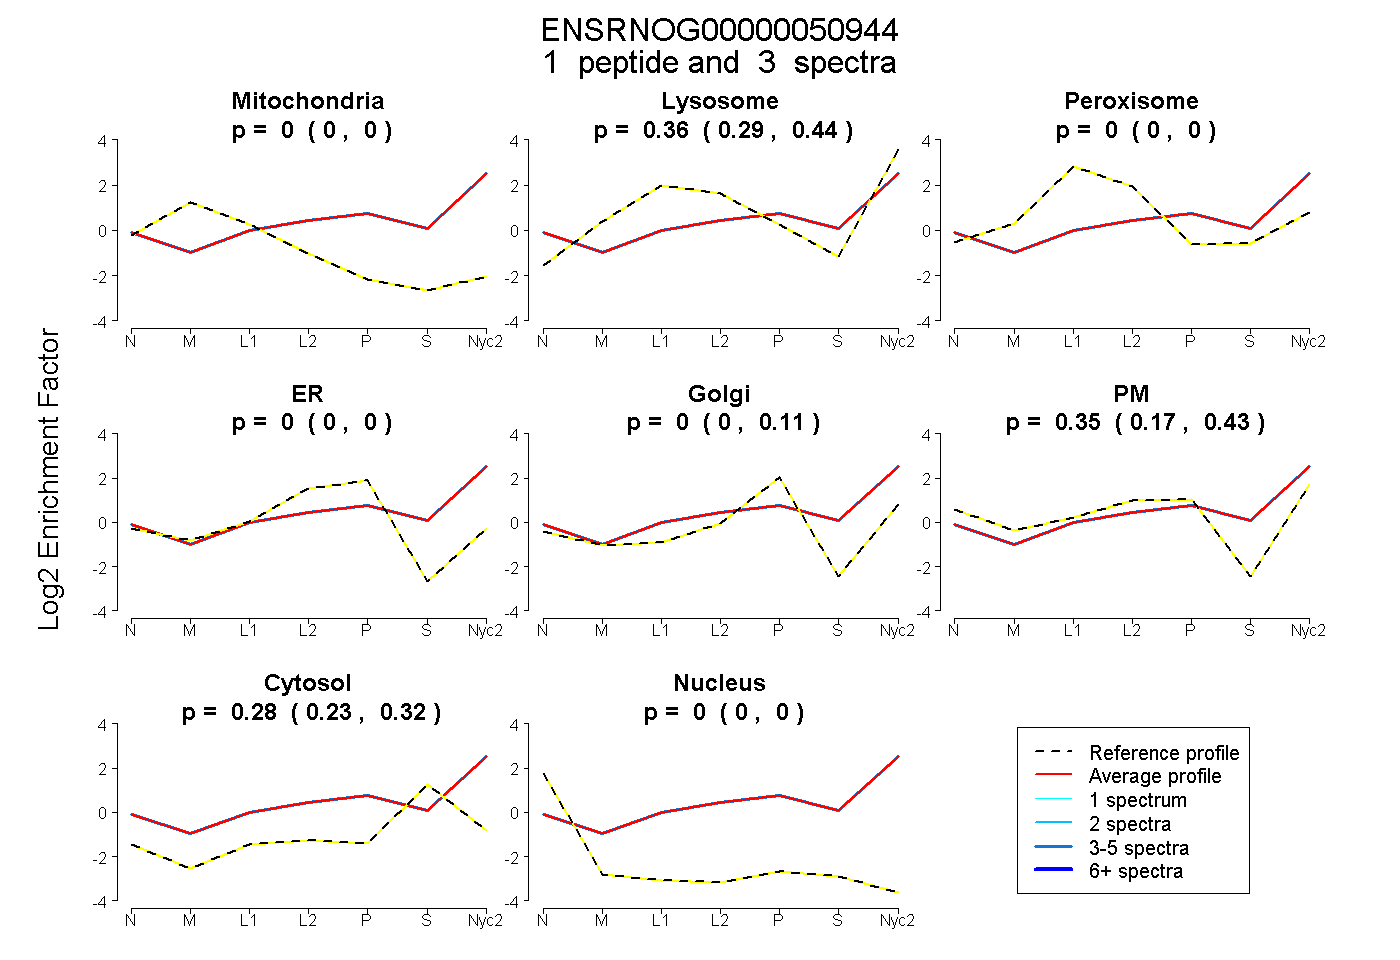
0.000 | 0.000
0.291 | 0.436
0.000 | 0.000
0.000 | 0.000
0.000 | 0.113
0.168 | 0.431
0.231 | 0.319
0.000 | 0.000
| Plot | Mito | Lyso | Perox | ER | Golgi | PM | Cytosol | Nucleus | |||||
| Expt A |
1 peptide |
3 spectra |
|
0.000 0.000 | 0.000 |
0.360 0.291 | 0.436 |
0.000 0.000 | 0.000 |
0.000 0.000 | 0.000 |
0.000 0.000 | 0.113 |
0.354 0.168 | 0.431 |
0.285 0.231 | 0.319 |
0.000 0.000 | 0.000 |