 7
7peptides
spectra
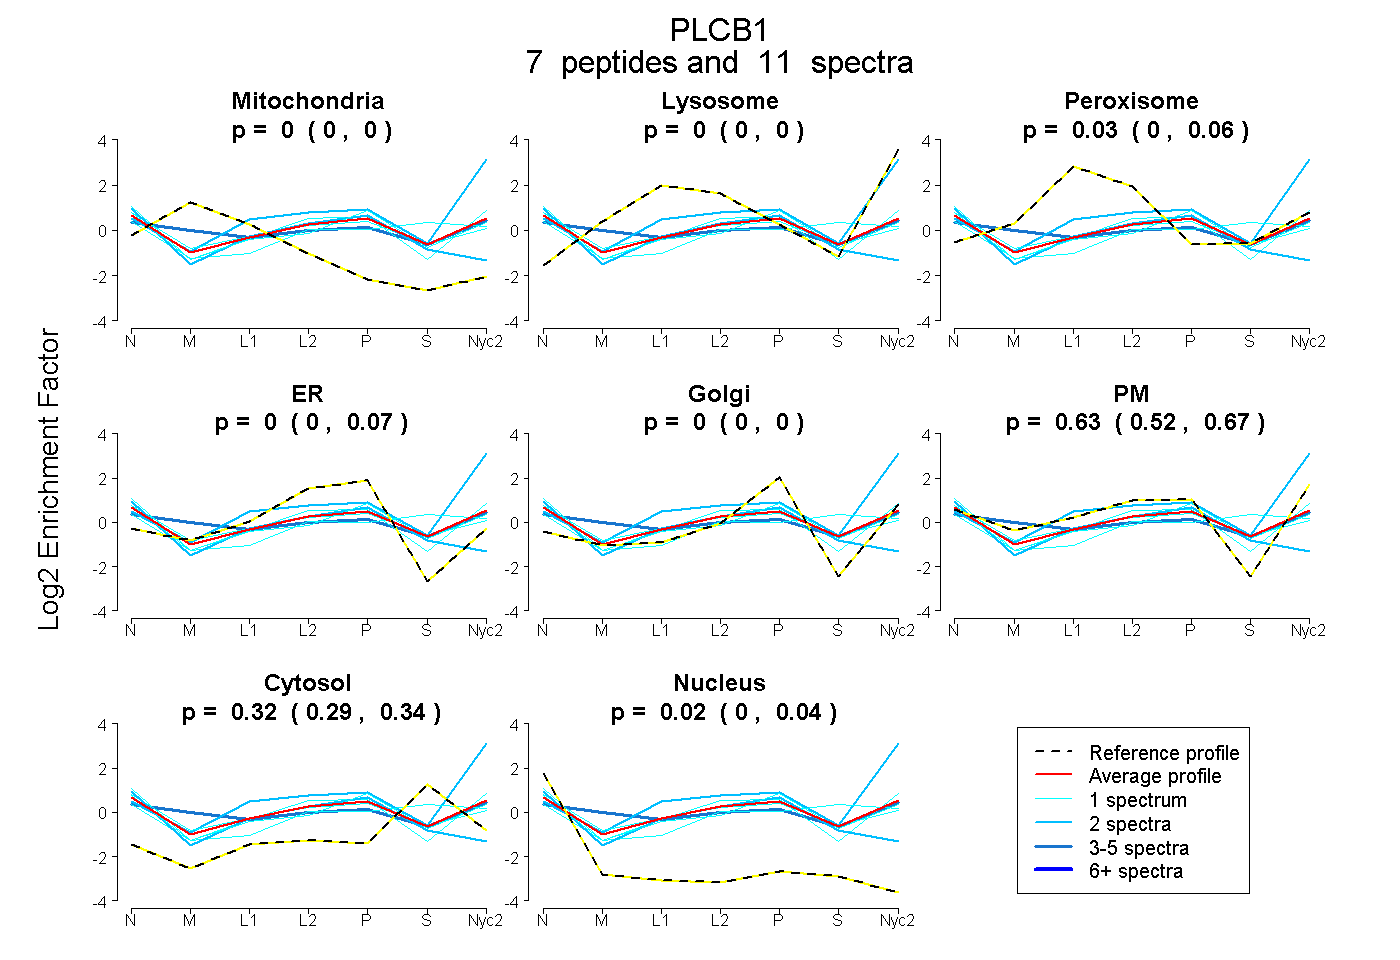
0.000 | 0.000
0.000 | 0.000
0.000 | 0.063
0.000 | 0.067
0.000 | 0.000
0.519 | 0.666
0.292 | 0.338
0.000 | 0.044
2peptides
spectra
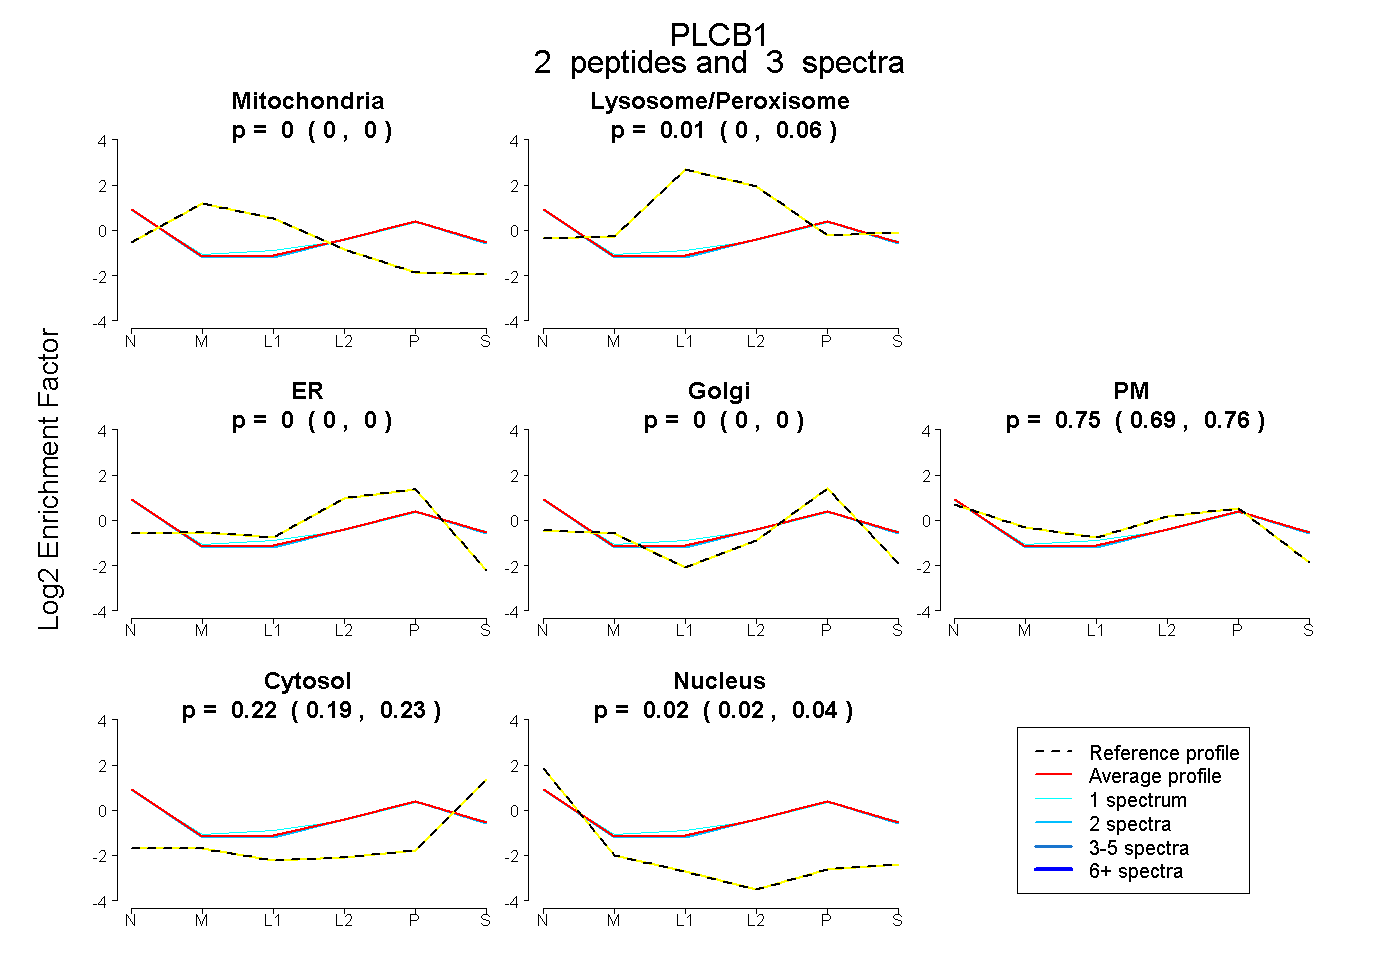
0.000 | 0.000
0.000 | 0.057
0.000 | 0.000
0.000 | 0.000
0.694 | 0.759
0.190 | 0.231
0.015 | 0.044
16peptides
spectra
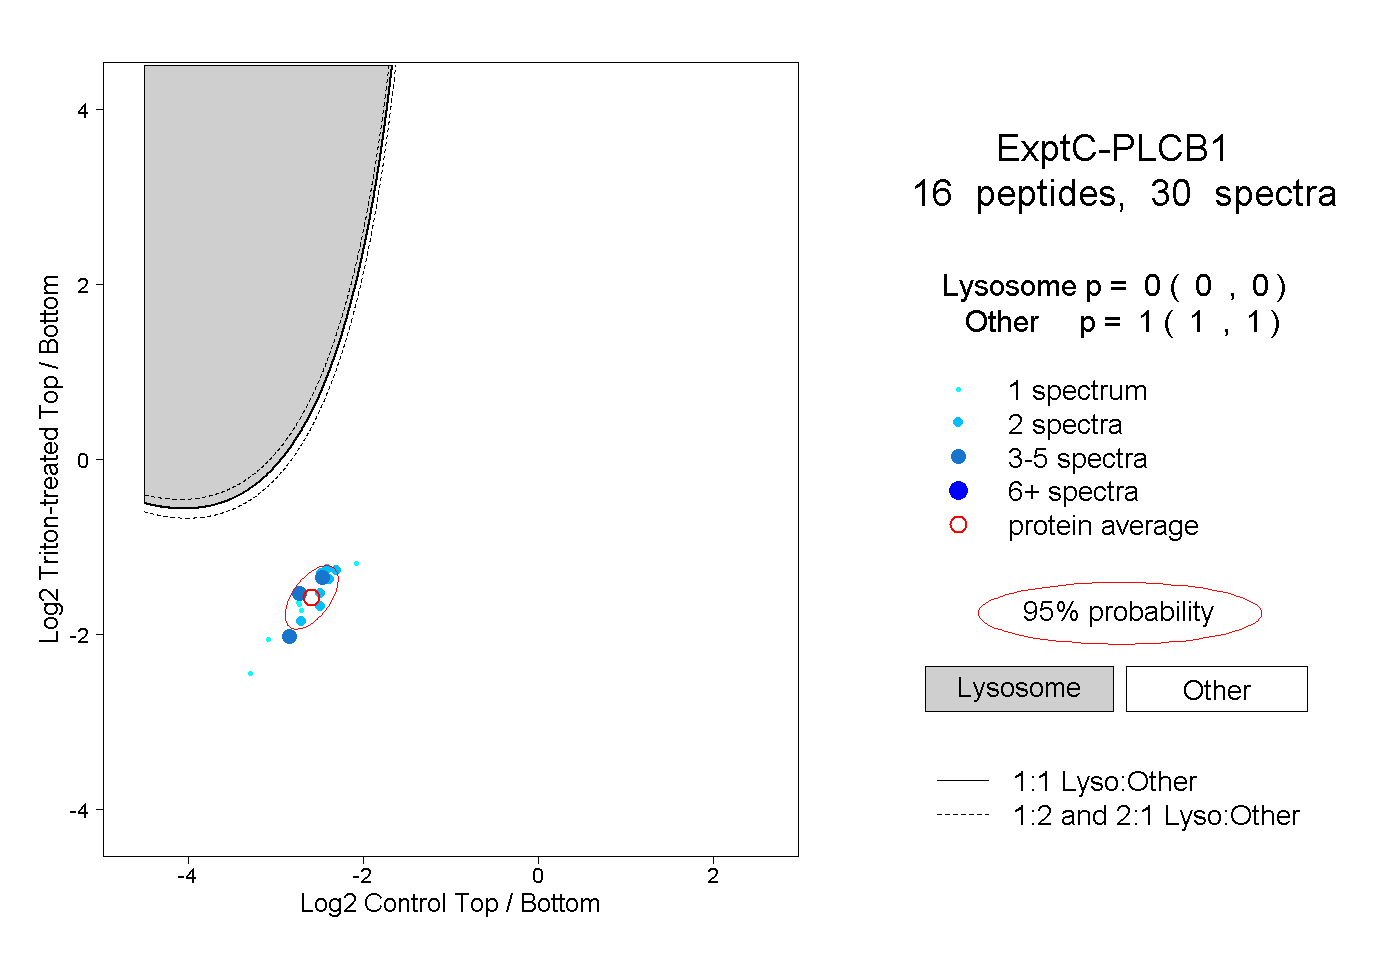
0.000 | 0.000
1.000 | 1.000
2peptides
spectra
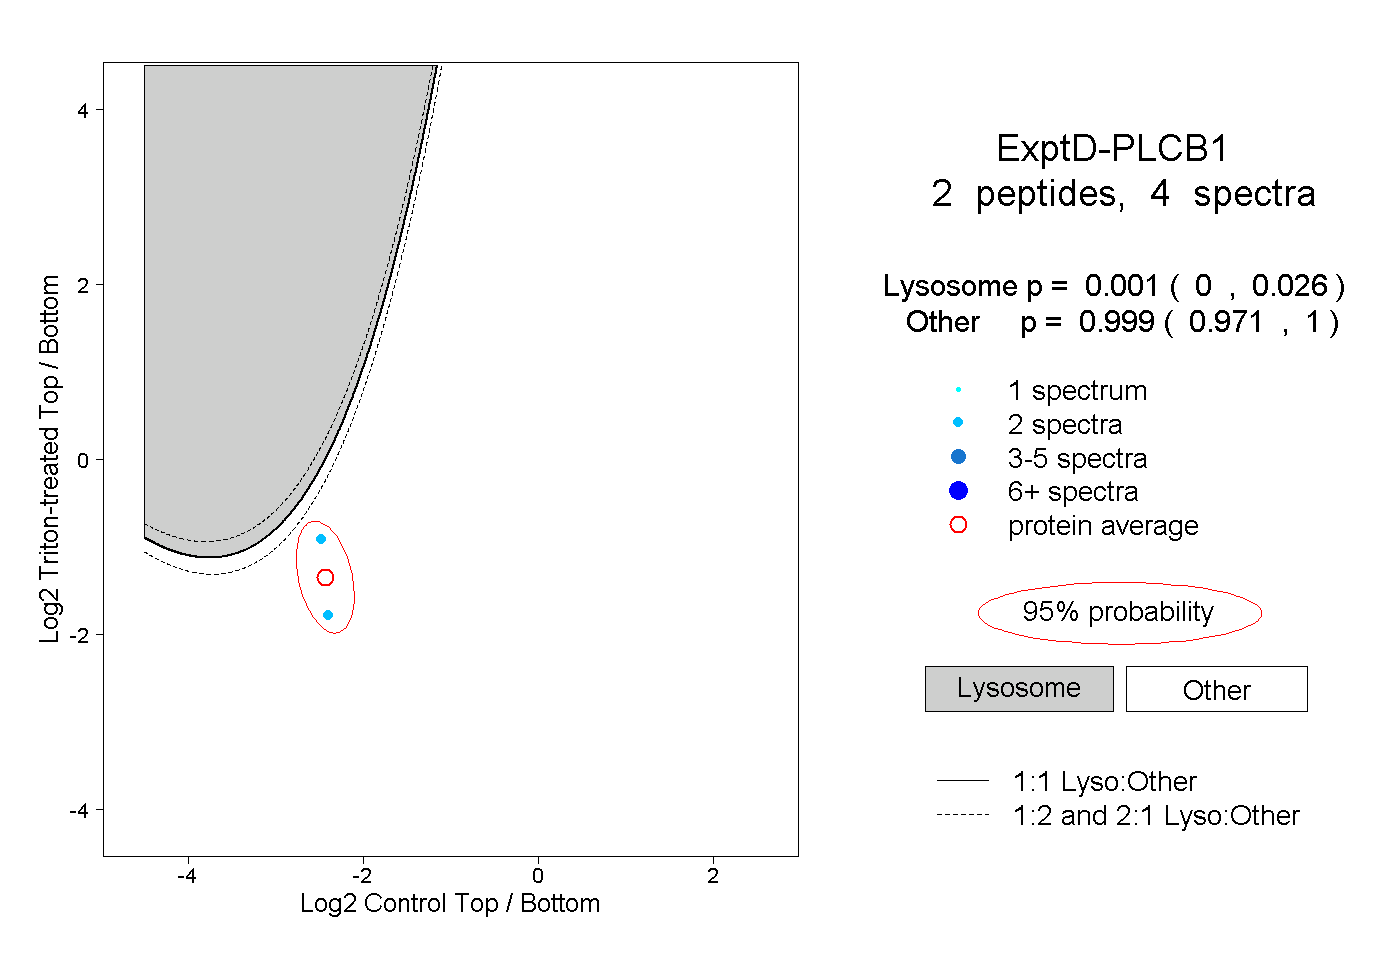
0.000 | 0.026
0.971 | 1.000