 4
4peptides
spectra
0.000 | 0.060
0.000 | 0.000
0.000 | 0.000
0.251 | 0.461
0.000 | 0.178
0.000 | 0.169
0.371 | 0.422
0.000 | 0.058
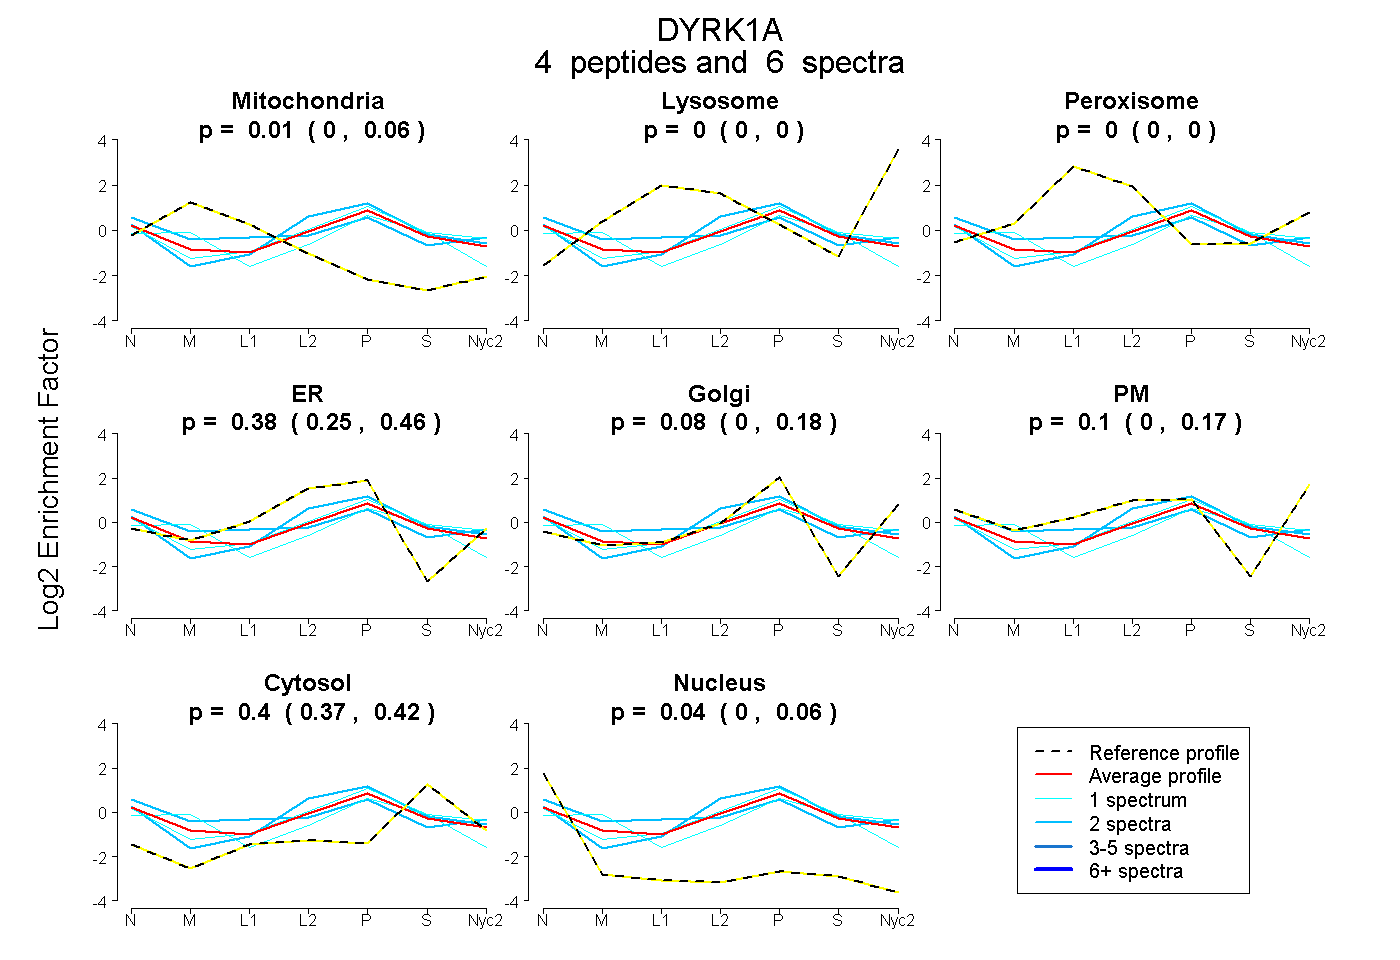
| Plot | Mito | Lyso | Perox | ER | Golgi | PM | Cytosol | Nucleus | |||||
| Expt A |
4 peptides |
6 spectra |
|
0.008 0.000 | 0.060 |
0.000 0.000 | 0.000 |
0.000 0.000 | 0.000 |
0.375 0.251 | 0.461 |
0.079 0.000 | 0.178 |
0.101 0.000 | 0.169 |
0.400 0.371 | 0.422 |
0.037 0.000 | 0.058 |
| 1 spectrum, IVEVLGIPPAHILDQAPK | 0.184 | 0.000 | 0.000 | 0.194 | 0.188 | 0.000 | 0.394 | 0.040 | ||
| 2 spectra, AFLNQAQIEVR | 0.000 | 0.000 | 0.000 | 0.542 | 0.038 | 0.004 | 0.416 | 0.000 | ||
| 2 spectra, IVDFGSSCQLGQR | 0.091 | 0.000 | 0.093 | 0.089 | 0.129 | 0.291 | 0.246 | 0.061 | ||
| 1 spectrum, LLELMNK | 0.000 | 0.000 | 0.000 | 0.292 | 0.169 | 0.111 | 0.428 | 0.000 |