 1
1peptide
spectra
0.064 | 0.198
0.221 | 0.451
0.100 | 0.549
0.000 | 0.320
0.000 | 0.017
0.000 | 0.000
0.000 | 0.000
1peptide
spectrum
NA | NA
NA | NA
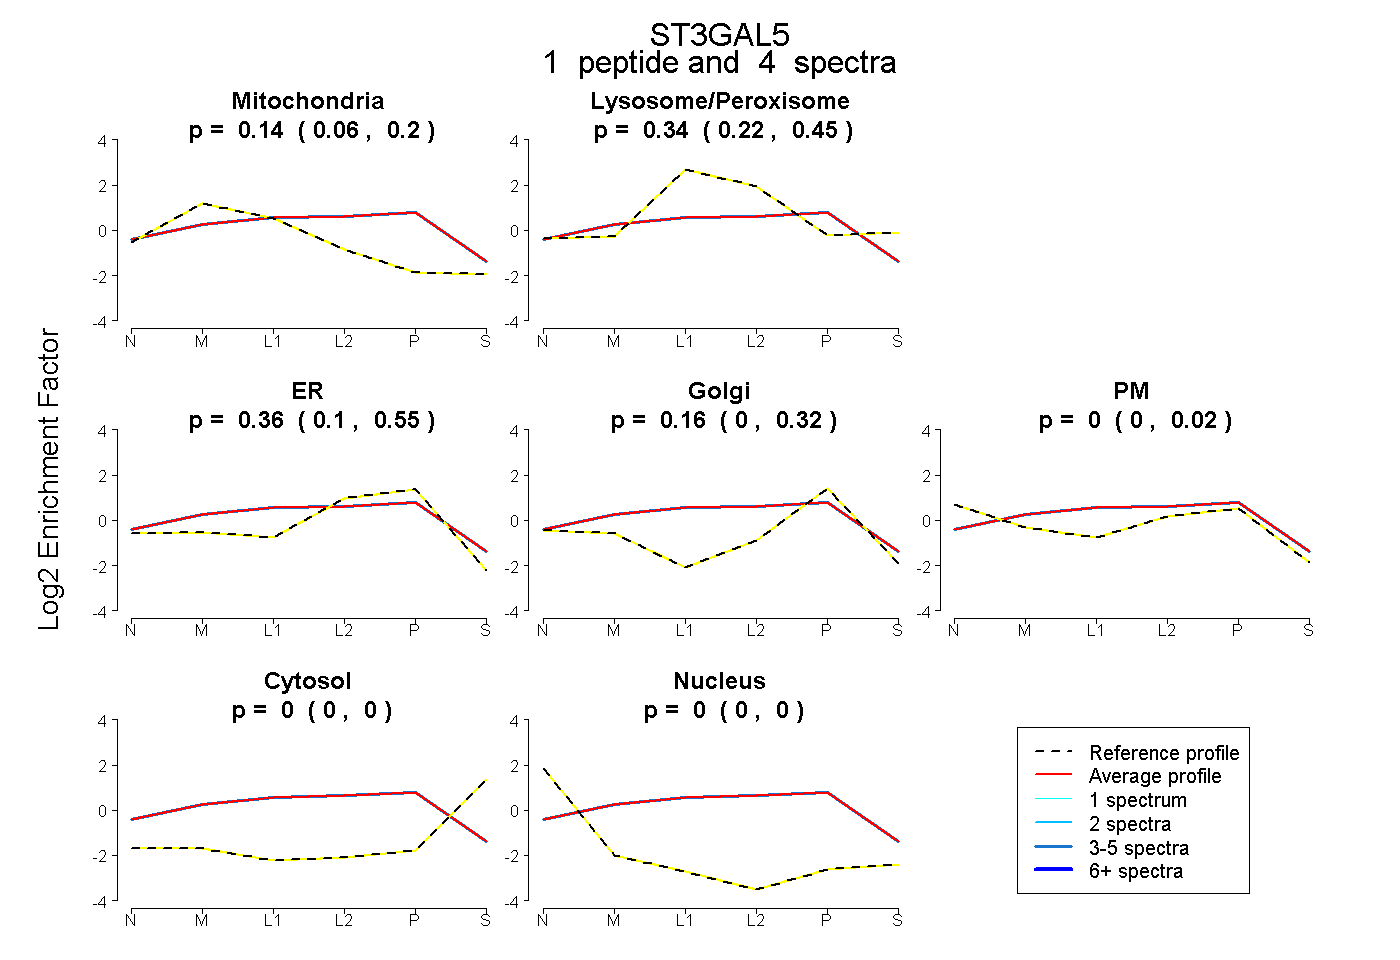
| Plot | Mito | Lyso or Perox | ER | Golgi | PM | Cytosol | Nucleus | ||||||
| Expt B |
1 peptide |
4 spectra |
|
0.141 0.064 | 0.198 |
0.341 0.221 | 0.451 |
0.356 0.100 | 0.549 |
0.161 0.000 | 0.320 |
0.000 0.000 | 0.017 |
0.000 0.000 | 0.000 |
0.000 0.000 | 0.000 |
|||
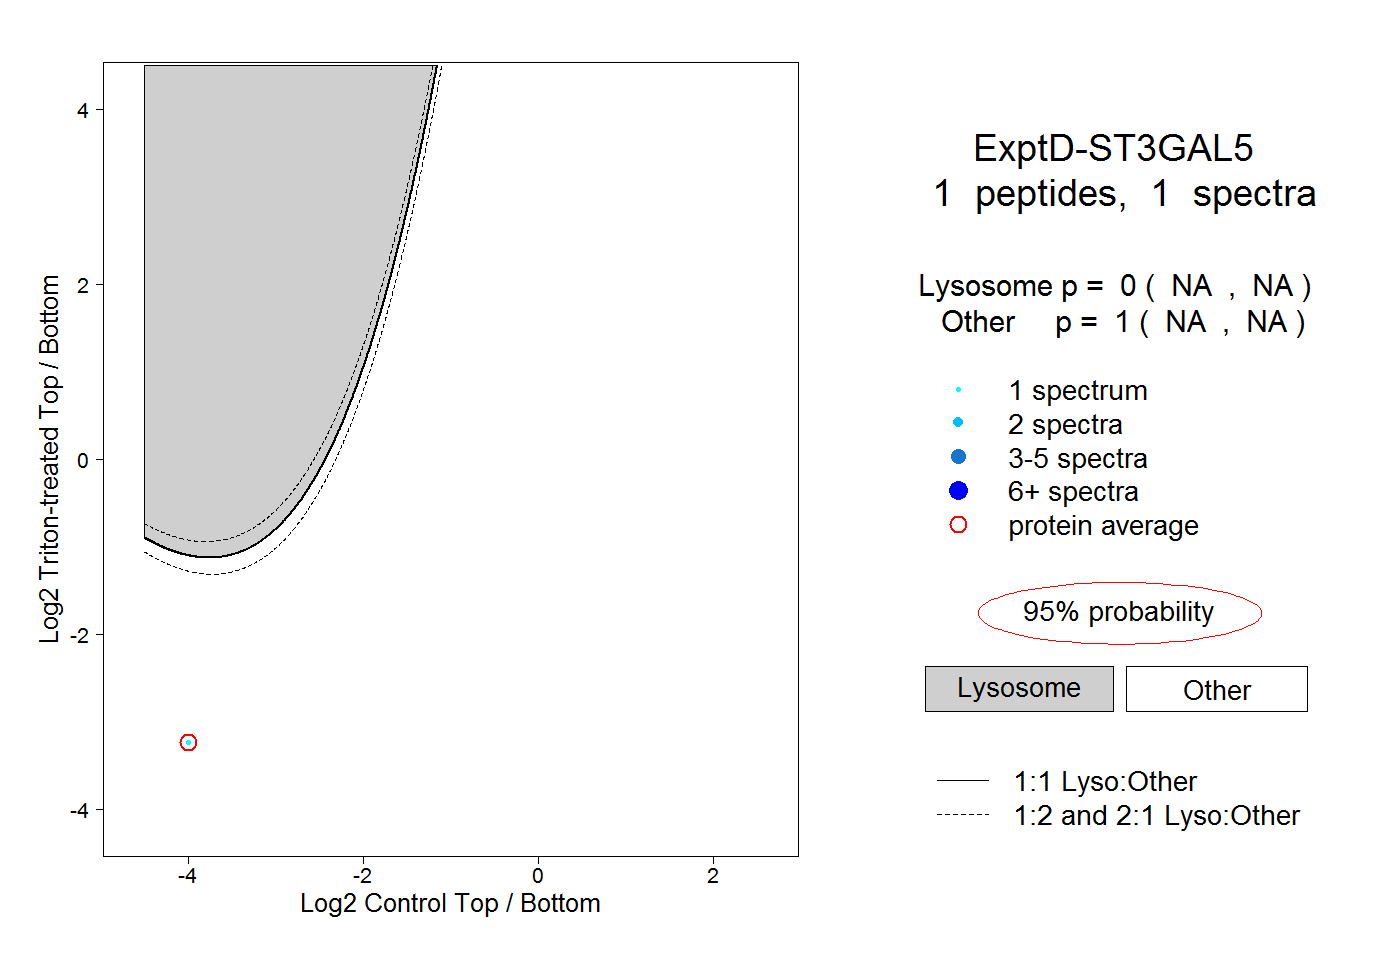
| Plot | Lyso | Other | |||||||||||
| Expt D |
1 peptide |
1 spectrum |
|
0.000 NA | NA |
1.000 NA | NA |