 12
12peptides
spectra
0.000 | 0.000
0.000 | 0.000
0.000 | 0.013
0.067 | 0.121
0.000 | 0.016
0.000 | 0.044
0.865 | 0.877
0.000 | 0.000
| Plot | Mito | Lyso | Perox | ER | Golgi | PM | Cytosol | Nucleus | |||||
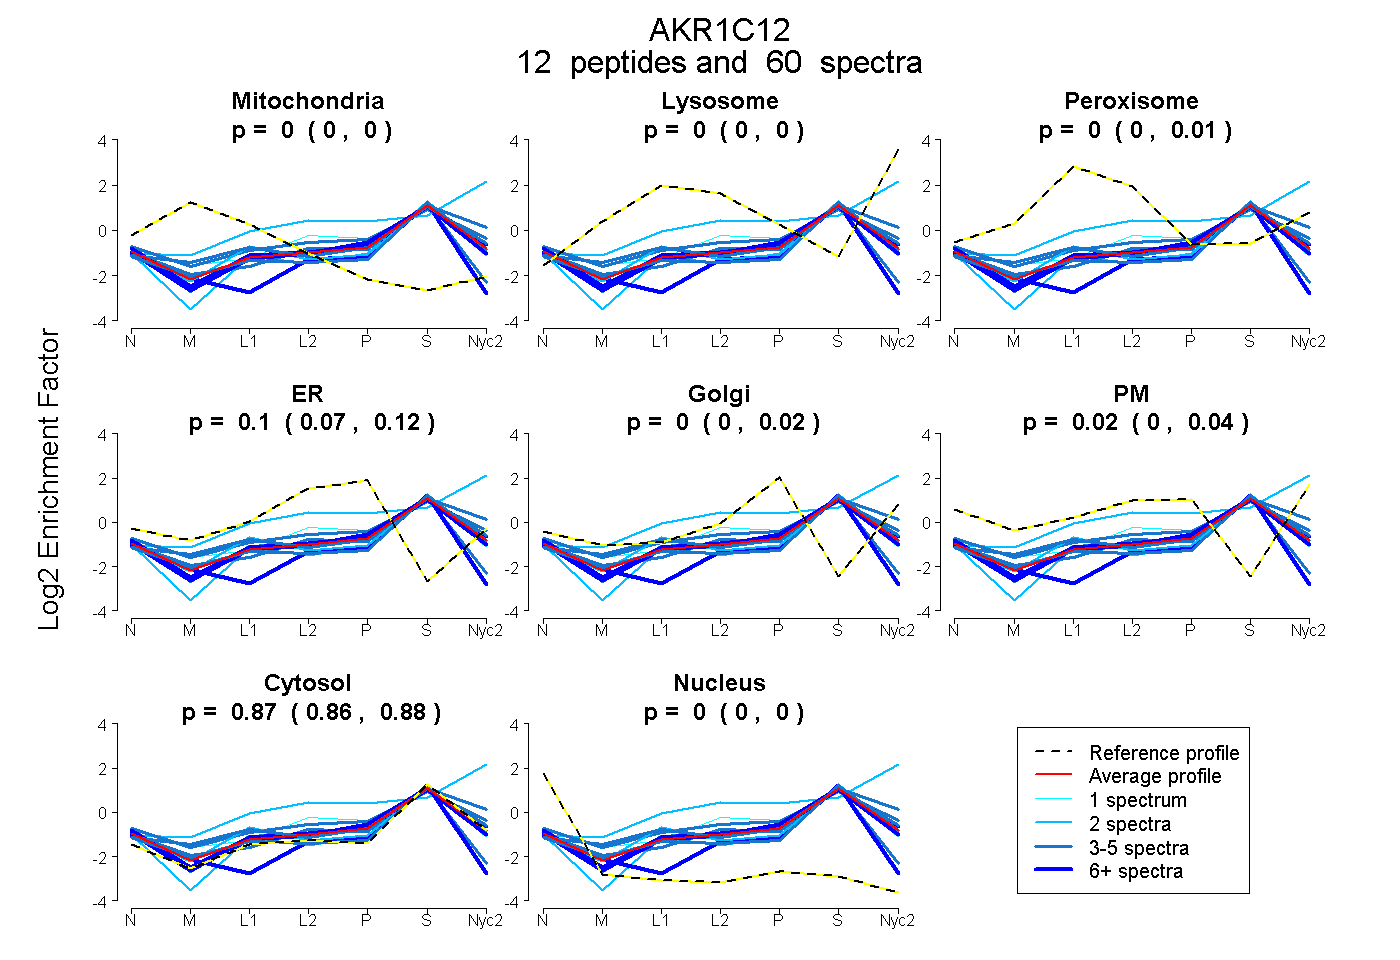
| Expt A |
12 peptides |
60 spectra |
|
0.000 0.000 | 0.000 |
0.000 0.000 | 0.000 |
0.003 0.000 | 0.013 |
0.103 0.067 | 0.121 |
0.000 0.000 | 0.016 |
0.022 0.000 | 0.044 |
0.873 0.865 | 0.877 |
0.000 0.000 | 0.000 |
| 3 spectra, FLLDTVDFCDTWEMLEK | 0.032 | 0.000 | 0.000 | 0.069 | 0.000 | 0.000 | 0.817 | 0.082 | ||
| 14 spectra, SSVDESPLDEK | 0.000 | 0.000 | 0.000 | 0.126 | 0.000 | 0.000 | 0.859 | 0.015 | ||
| 5 spectra, TLDGLNK | 0.046 | 0.011 | 0.112 | 0.000 | 0.060 | 0.000 | 0.771 | 0.000 | ||
| 3 spectra, TEMVRPALEK | 0.063 | 0.000 | 0.000 | 0.000 | 0.000 | 0.010 | 0.928 | 0.000 | ||
| 10 spectra, LWCSCFR | 0.000 | 0.000 | 0.000 | 0.000 | 0.000 | 0.000 | 0.801 | 0.199 | ||
| 5 spectra, GVVPLAQSFK | 0.000 | 0.025 | 0.000 | 0.000 | 0.000 | 0.140 | 0.834 | 0.000 | ||
| 2 spectra, ENLQVFEFQLSPEDMK | 0.000 | 0.000 | 0.000 | 0.000 | 0.000 | 0.000 | 0.966 | 0.034 | ||
| 2 spectra, SLEAAHLAIDVGYR | 0.003 | 0.000 | 0.107 | 0.000 | 0.000 | 0.000 | 0.853 | 0.037 | ||
| 8 spectra, SPALIALR | 0.000 | 0.000 | 0.000 | 0.029 | 0.109 | 0.000 | 0.862 | 0.000 | ||
| 2 spectra, AGVVK | 0.000 | 0.514 | 0.000 | 0.000 | 0.069 | 0.000 | 0.417 | 0.000 | ||
| 5 spectra, SIGVSNFNHK | 0.000 | 0.000 | 0.109 | 0.010 | 0.085 | 0.084 | 0.712 | 0.000 | ||
| 1 spectrum, LNDGHFIPALGFGTYKPK | 0.000 | 0.000 | 0.039 | 0.213 | 0.000 | 0.000 | 0.748 | 0.000 |
| Plot | Mito | Lyso or Perox | ER | Golgi | PM | Cytosol | Nucleus | ||||||
| Expt B |
6 peptides |
24 spectra |
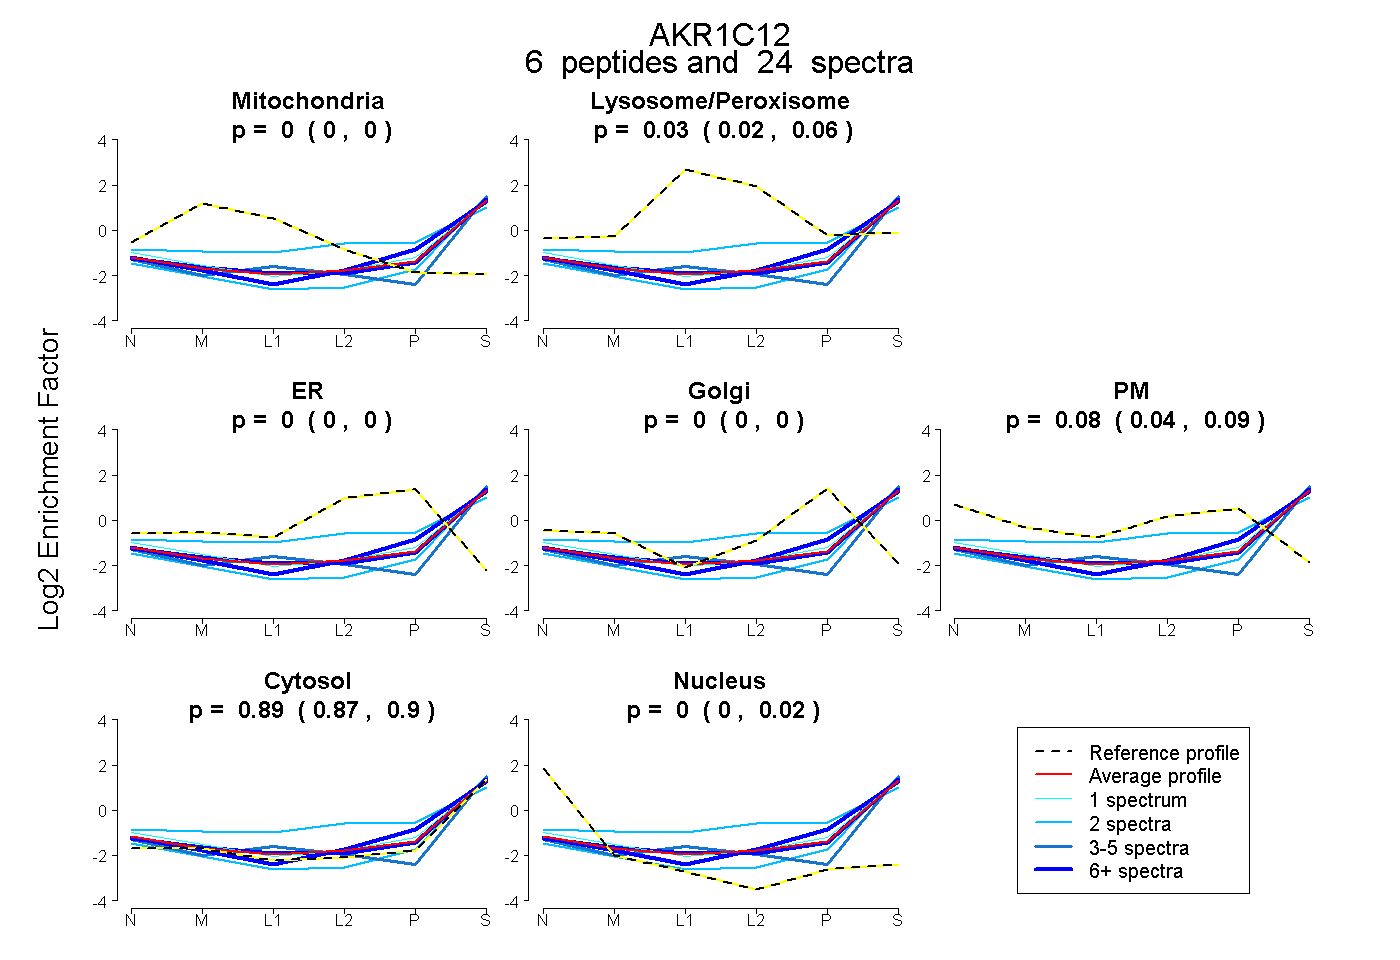 |
0.000 0.000 | 0.000 |
0.035 0.015 | 0.055 |
0.000 0.000 | 0.000 |
0.000 0.000 | 0.000 |
0.077 0.042 | 0.091 |
0.888 0.875 | 0.896 |
0.000 0.000 | 0.016 |
|||
| Plot | Lyso | Other | |||||||||||
| Expt C |
11 peptides |
112 spectra |
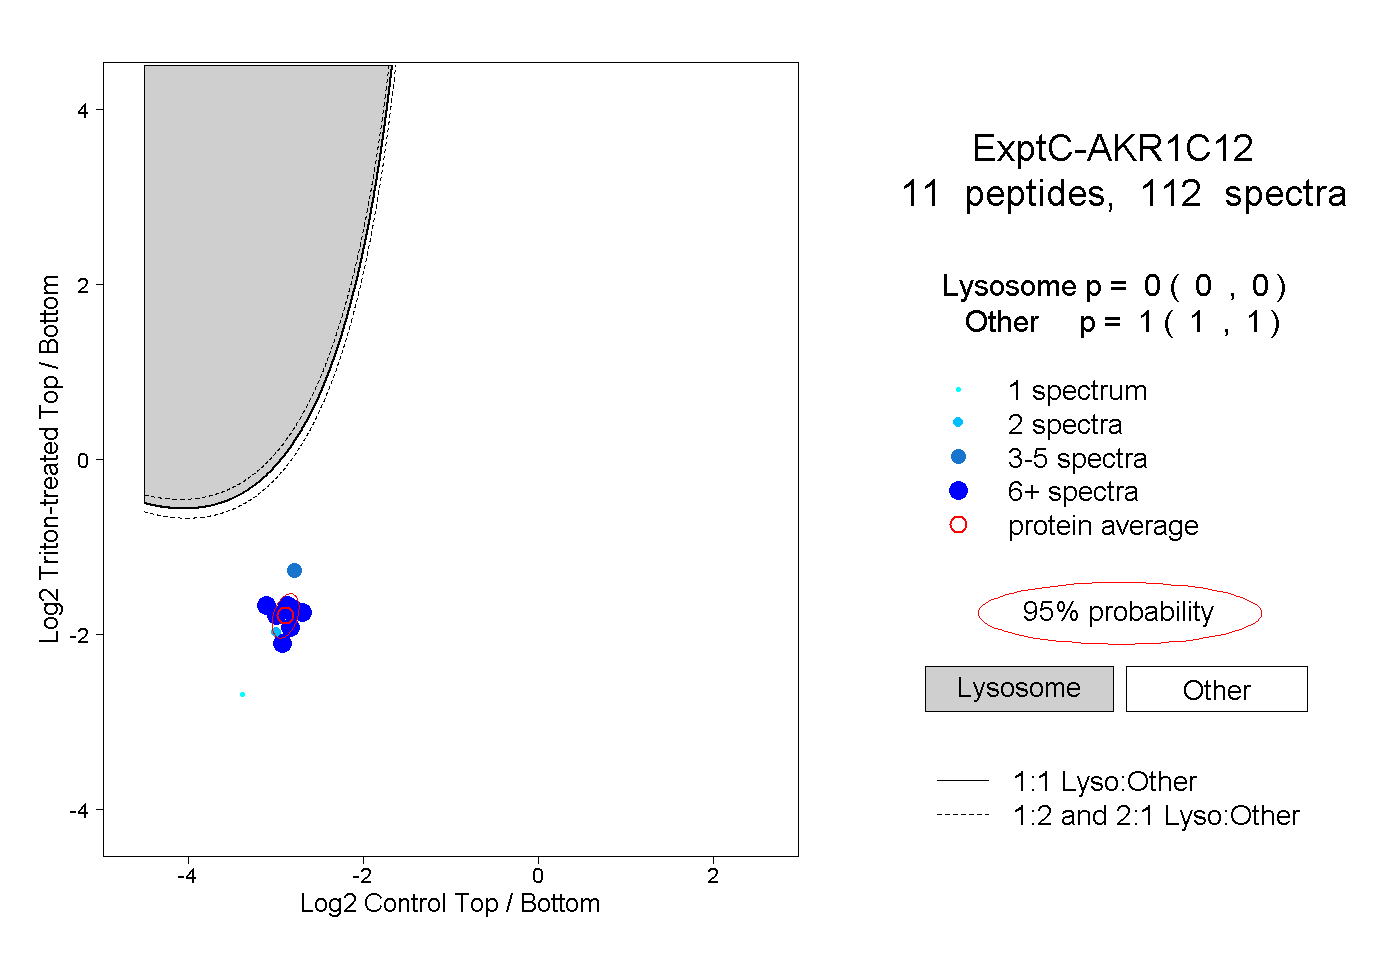 |
0.000 0.000 | 0.000 |
1.000 1.000 | 1.000 |
||||||||
| Plot | Lyso | Other | |||||||||||
| Expt D |
2 peptides |
4 spectra |
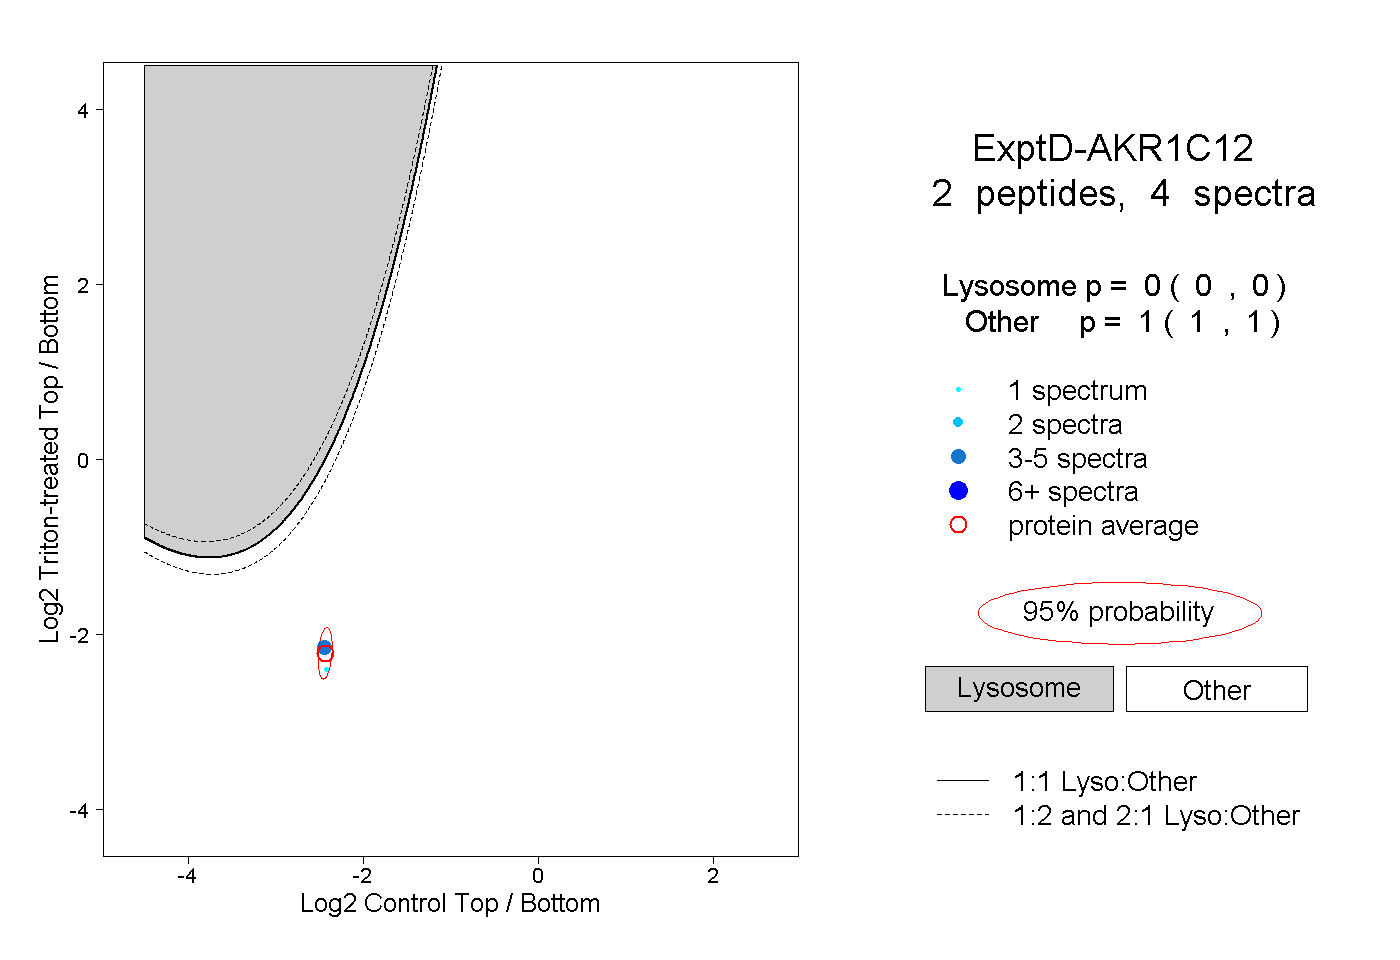 |
0.000 0.000 | 0.000 |
1.000 1.000 | 1.000 |