 2
2peptides
spectra

0.000 | 0.000
0.000 | 0.008
0.000 | 0.008
0.067 | 0.170
0.365 | 0.521
0.000 | 0.023
0.376 | 0.460
0.000 | 0.000
| Plot | Mito | Lyso | Perox | ER | Golgi | PM | Cytosol | Nucleus | |||||
| Expt A |
2 peptides |
3 spectra |
|
0.000 0.000 | 0.000 |
0.000 0.000 | 0.008 |
0.000 0.000 | 0.008 |
0.126 0.067 | 0.170 |
0.453 0.365 | 0.521 |
0.000 0.000 | 0.023 |
0.421 0.376 | 0.460 |
0.000 0.000 | 0.000 |
| 2 spectra, TPSLPTPPTR | 0.000 | 0.000 | 0.000 | 0.093 | 0.554 | 0.000 | 0.353 | 0.000 | ||
| 1 spectrum, EATHQPLGTRPEDVER | 0.000 | 0.000 | 0.000 | 0.193 | 0.250 | 0.000 | 0.556 | 0.000 |
| Plot | Lyso | Other | |||||||||||
| Expt C |
2 peptides |
3 spectra |
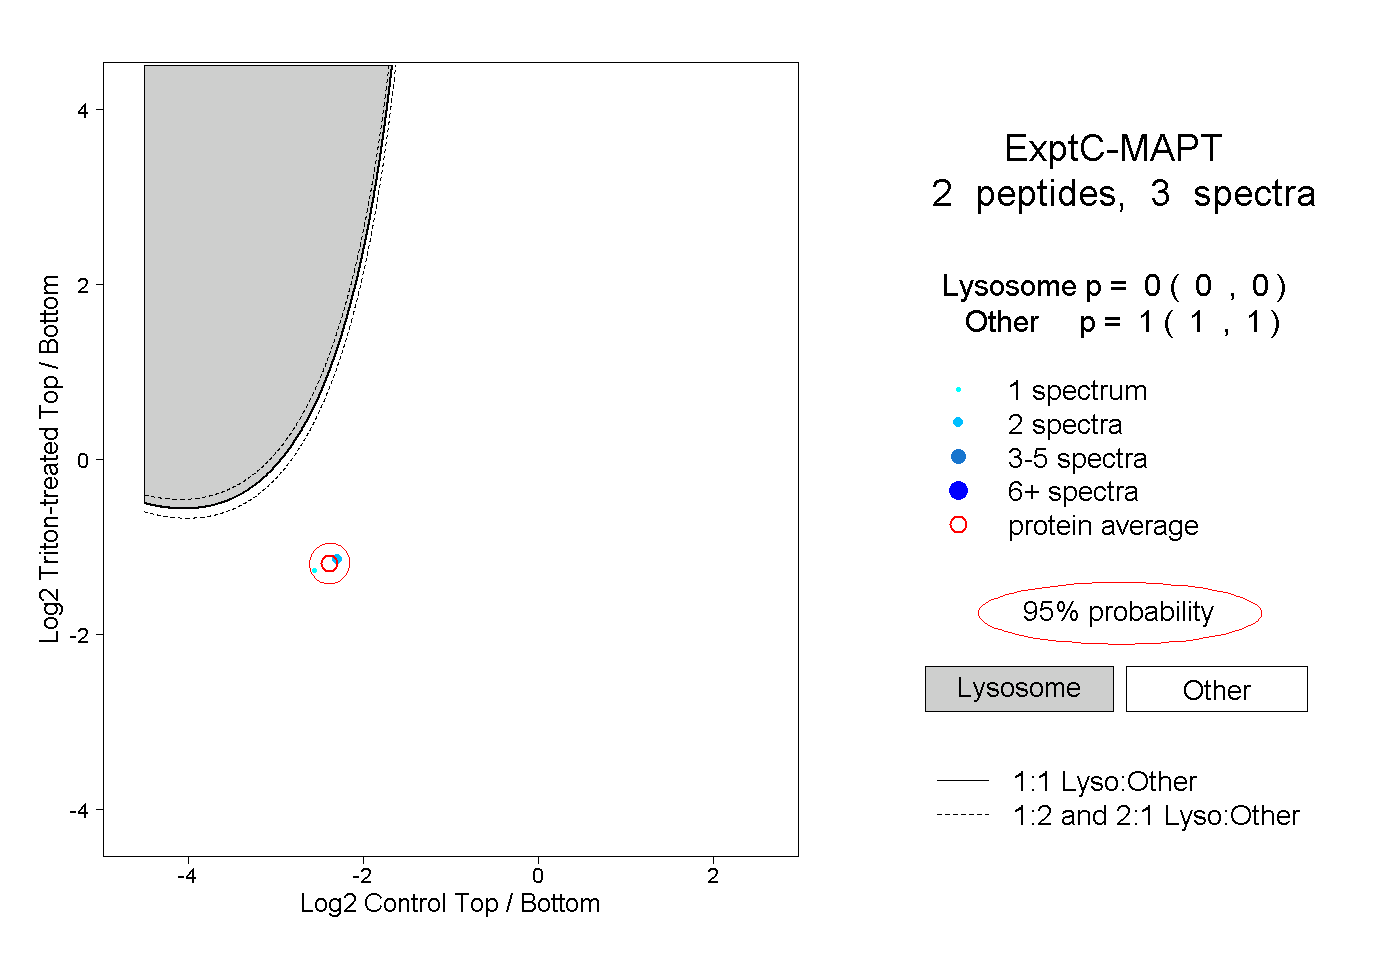 |
0.000 0.000 | 0.000 |
1.000 1.000 | 1.000 |