 3
3peptides
spectra
0.000 | 0.049
0.000 | 0.339
0.002 | 0.597
0.000 | 0.146
0.000 | 0.199
0.000 | 0.246
0.179 | 0.418
0.000 | 0.000
1peptide
spectra
NA | NA
NA | NA
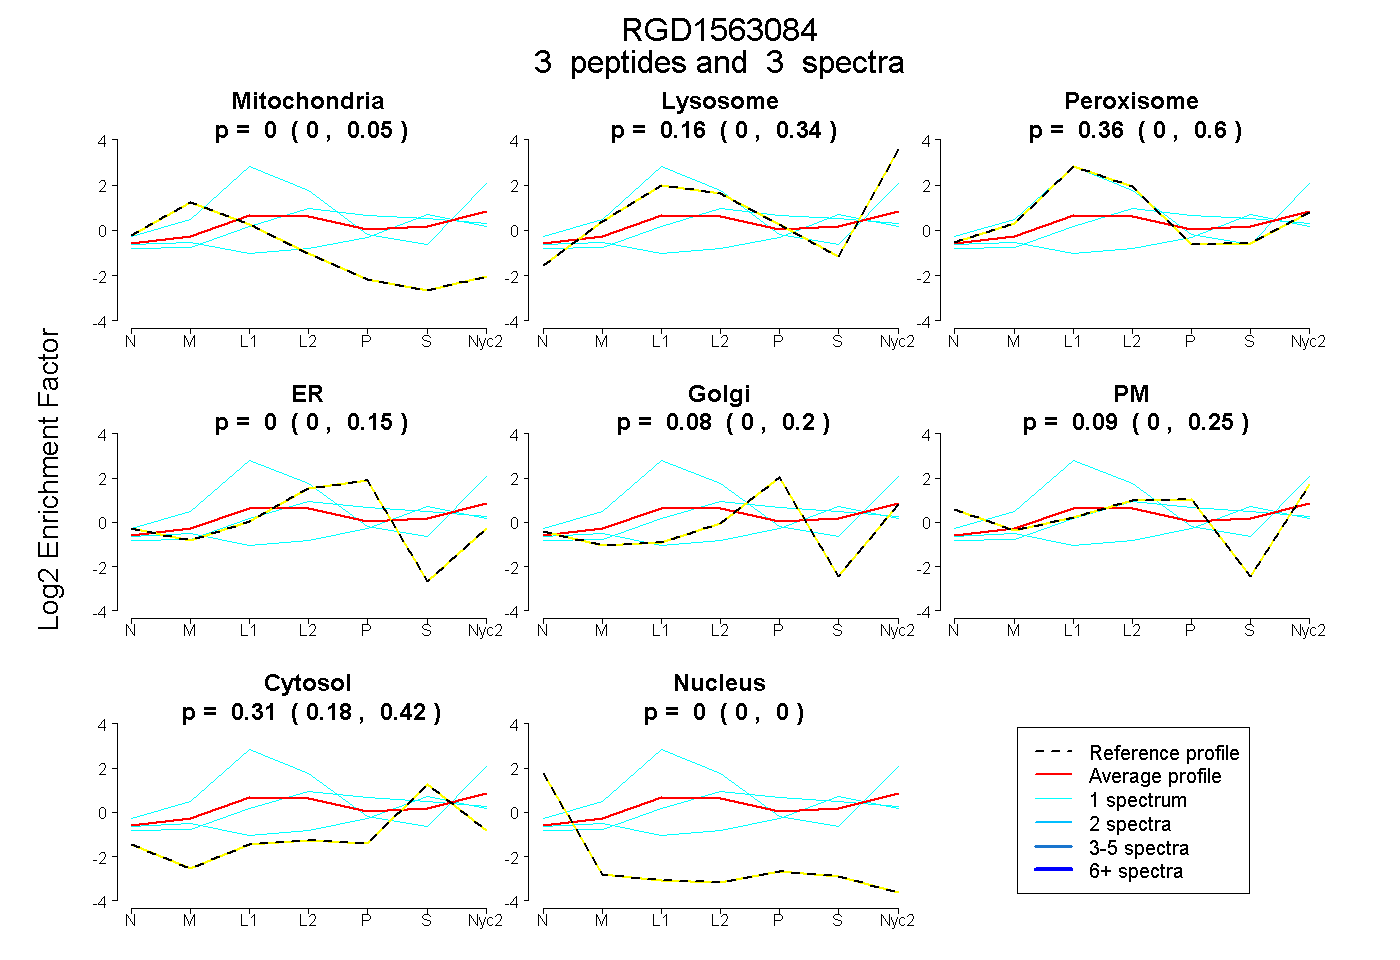
| Plot | Mito | Lyso | Perox | ER | Golgi | PM | Cytosol | Nucleus | |||||
| Expt A |
3 peptides |
3 spectra |
|
0.000 0.000 | 0.049 |
0.159 0.000 | 0.339 |
0.359 0.002 | 0.597 |
0.000 0.000 | 0.146 |
0.082 0.000 | 0.199 |
0.092 0.000 | 0.246 |
0.308 0.179 | 0.418 |
0.000 0.000 | 0.000 |
||
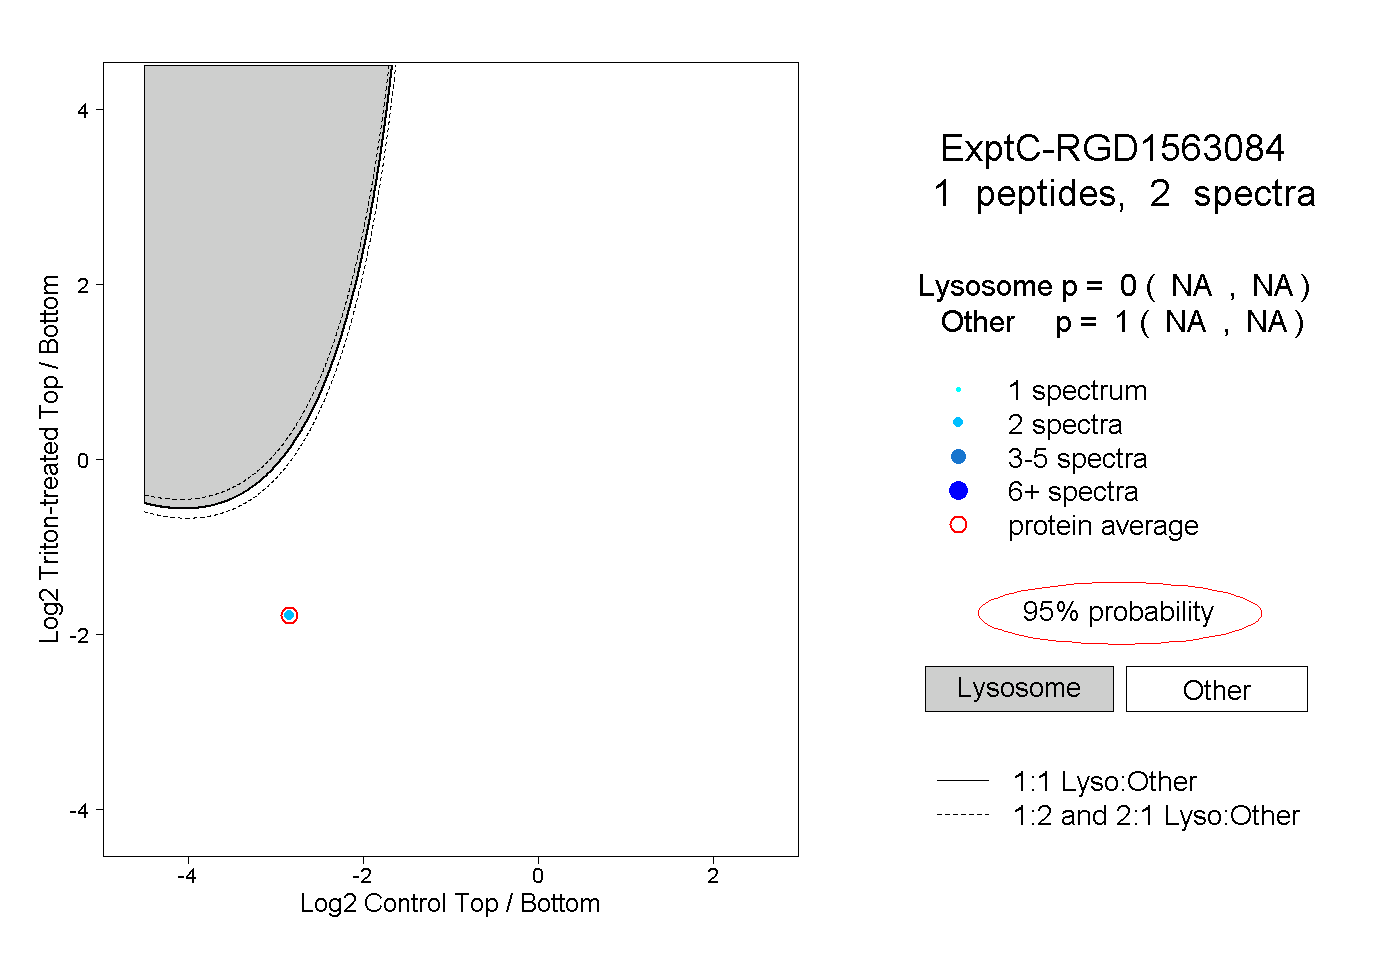
| Plot | Lyso | Other | |||||||||||
| Expt C |
1 peptide |
2 spectra |
|
0.000 NA | NA |
1.000 NA | NA |