 7
7peptides
spectra
0.000 | 0.000
0.000 | 0.000
0.173 | 0.226
0.109 | 0.147
0.000 | 0.000
0.000 | 0.000
0.336 | 0.384
0.287 | 0.323
| Plot | Mito | Lyso | Perox | ER | Golgi | PM | Cytosol | Nucleus | |||||
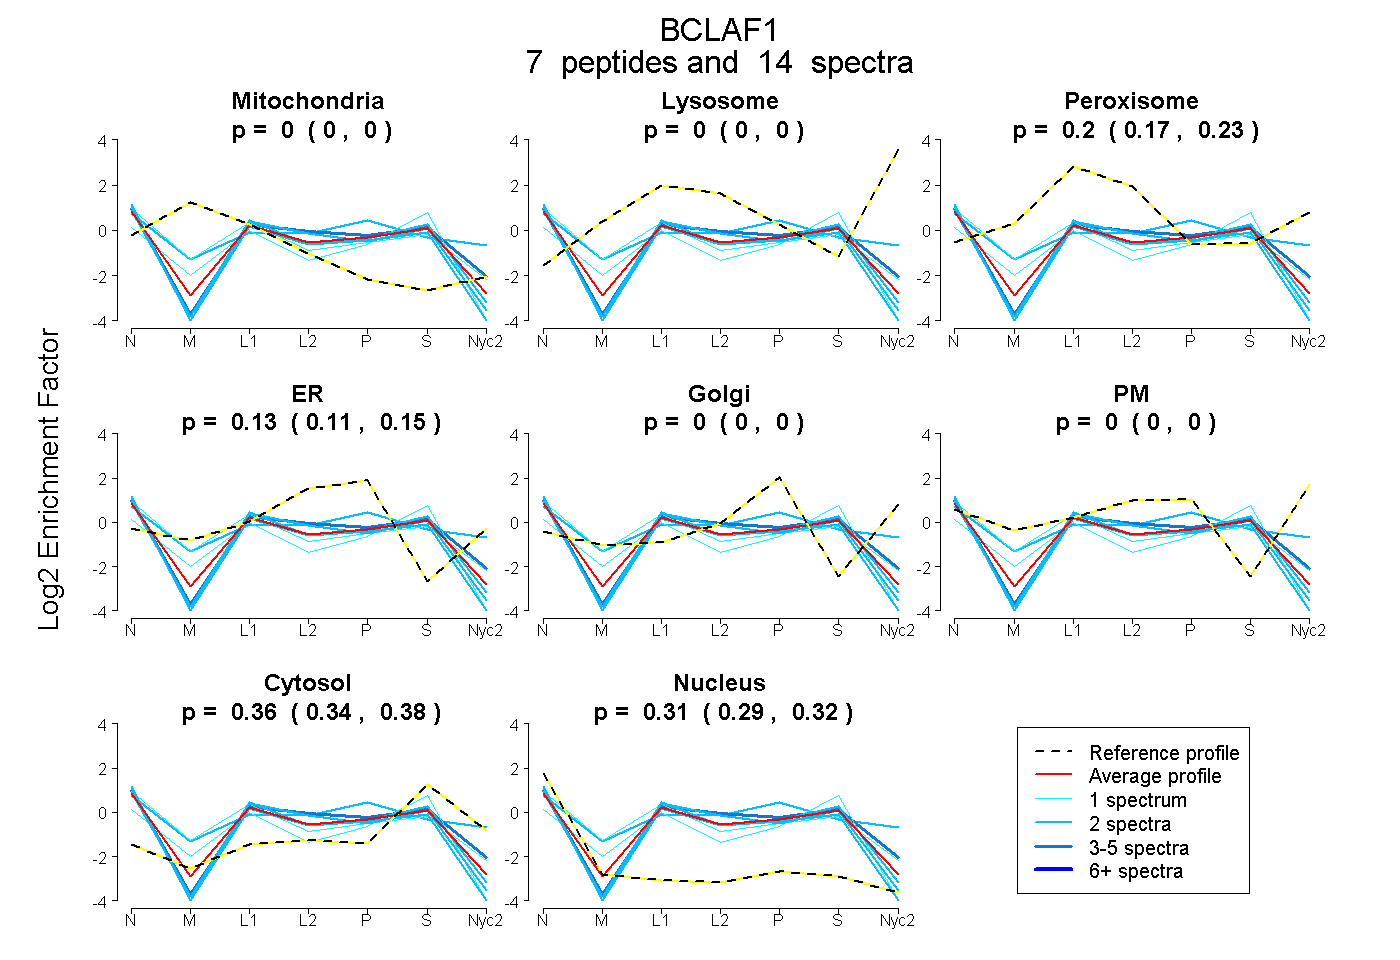
| Expt A |
7 peptides |
14 spectra |
|
0.000 0.000 | 0.000 |
0.000 0.000 | 0.000 |
0.203 0.173 | 0.226 |
0.129 0.109 | 0.147 |
0.000 0.000 | 0.000 |
0.000 0.000 | 0.000 |
0.362 0.336 | 0.384 |
0.306 0.287 | 0.323 |
| 1 spectrum, LLASTLVHSVK | 0.045 | 0.000 | 0.152 | 0.000 | 0.000 | 0.000 | 0.502 | 0.301 | ||
| 4 spectra, FTDEESR | 0.000 | 0.000 | 0.155 | 0.195 | 0.000 | 0.000 | 0.423 | 0.226 | ||
| 2 spectra, VFLLDR | 0.000 | 0.000 | 0.172 | 0.113 | 0.000 | 0.000 | 0.361 | 0.354 | ||
| 1 spectrum, LPQASK | 0.000 | 0.000 | 0.413 | 0.024 | 0.000 | 0.000 | 0.200 | 0.363 | ||
| 2 spectra, SPAVTLNER | 0.000 | 0.000 | 0.113 | 0.130 | 0.000 | 0.000 | 0.335 | 0.422 | ||
| 2 spectra, EVQSPEQVK | 0.000 | 0.000 | 0.155 | 0.234 | 0.000 | 0.175 | 0.314 | 0.122 | ||
| 2 spectra, MAPVPLDDSNRPASLTK | 0.000 | 0.000 | 0.161 | 0.102 | 0.000 | 0.000 | 0.422 | 0.315 |
| Plot | Mito | Lyso or Perox | ER | Golgi | PM | Cytosol | Nucleus | ||||||
| Expt B |
3 peptides |
5 spectra |
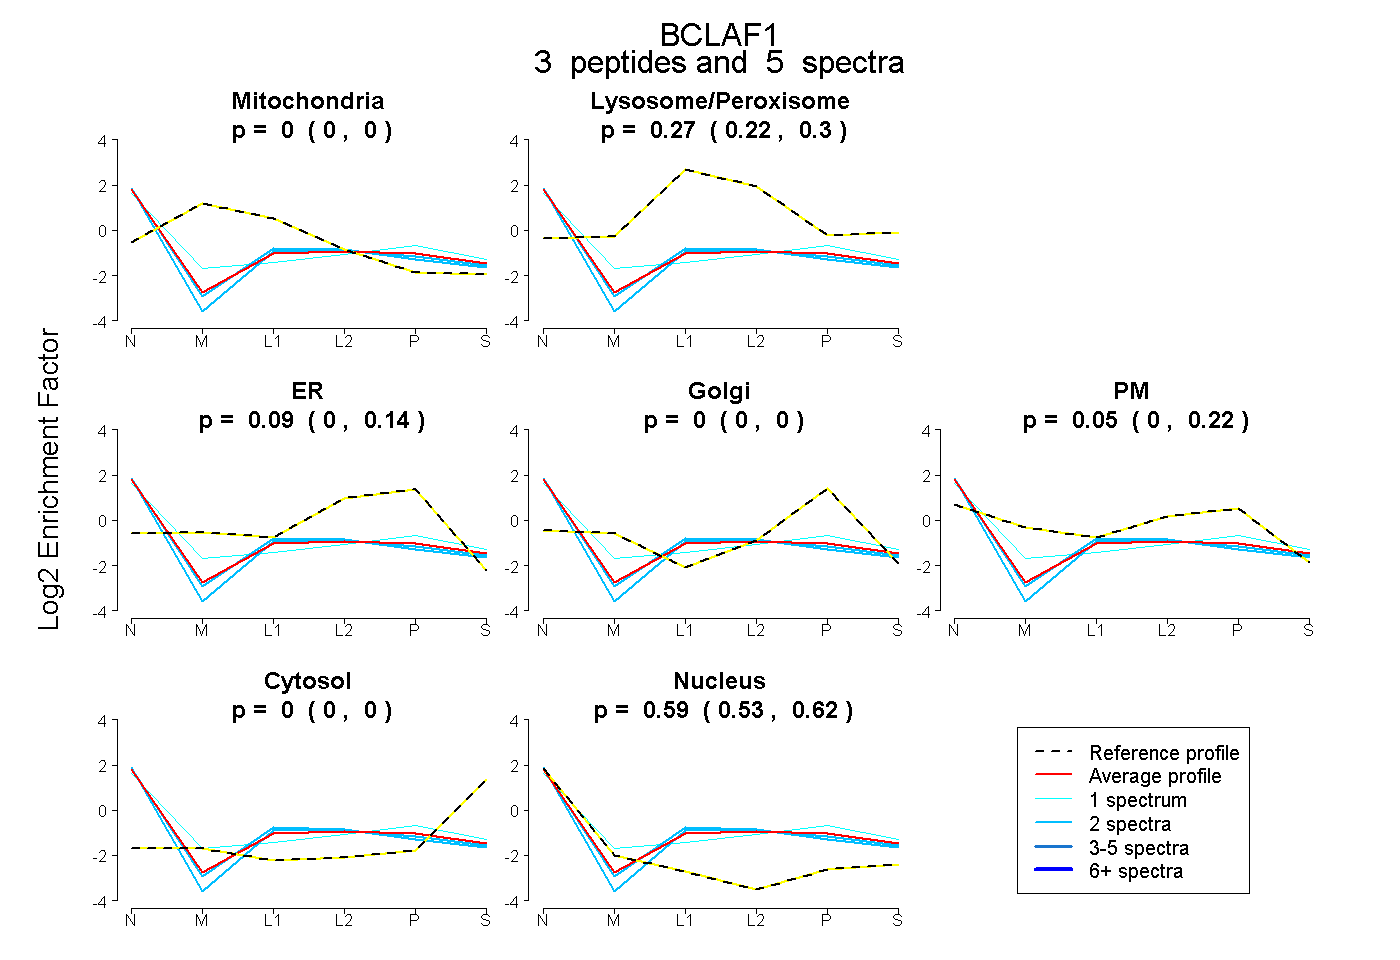 |
0.000 0.000 | 0.000 |
0.269 0.221 | 0.298 |
0.086 0.000 | 0.136 |
0.000 0.000 | 0.000 |
0.051 0.000 | 0.223 |
0.000 0.000 | 0.000 |
0.594 0.531 | 0.624 |
|||
| Plot | Lyso | Other | |||||||||||
| Expt C |
2 peptides |
3 spectra |
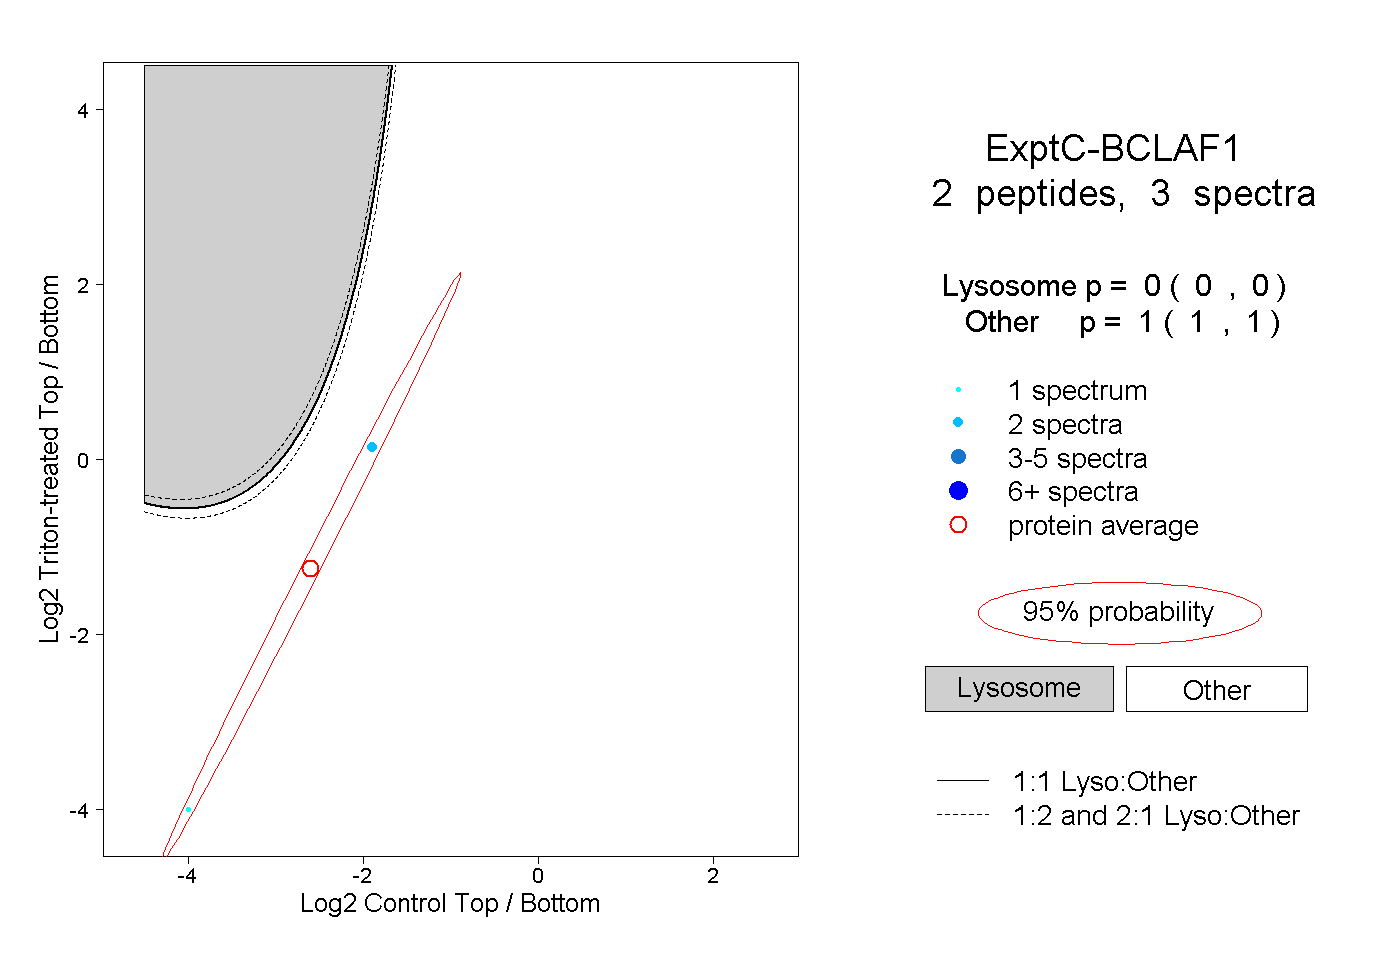 |
0.000 0.000 | 0.000 |
1.000 1.000 | 1.000 |
||||||||
| Plot | Lyso | Other | |||||||||||
| Expt D |
1 peptide |
2 spectra |
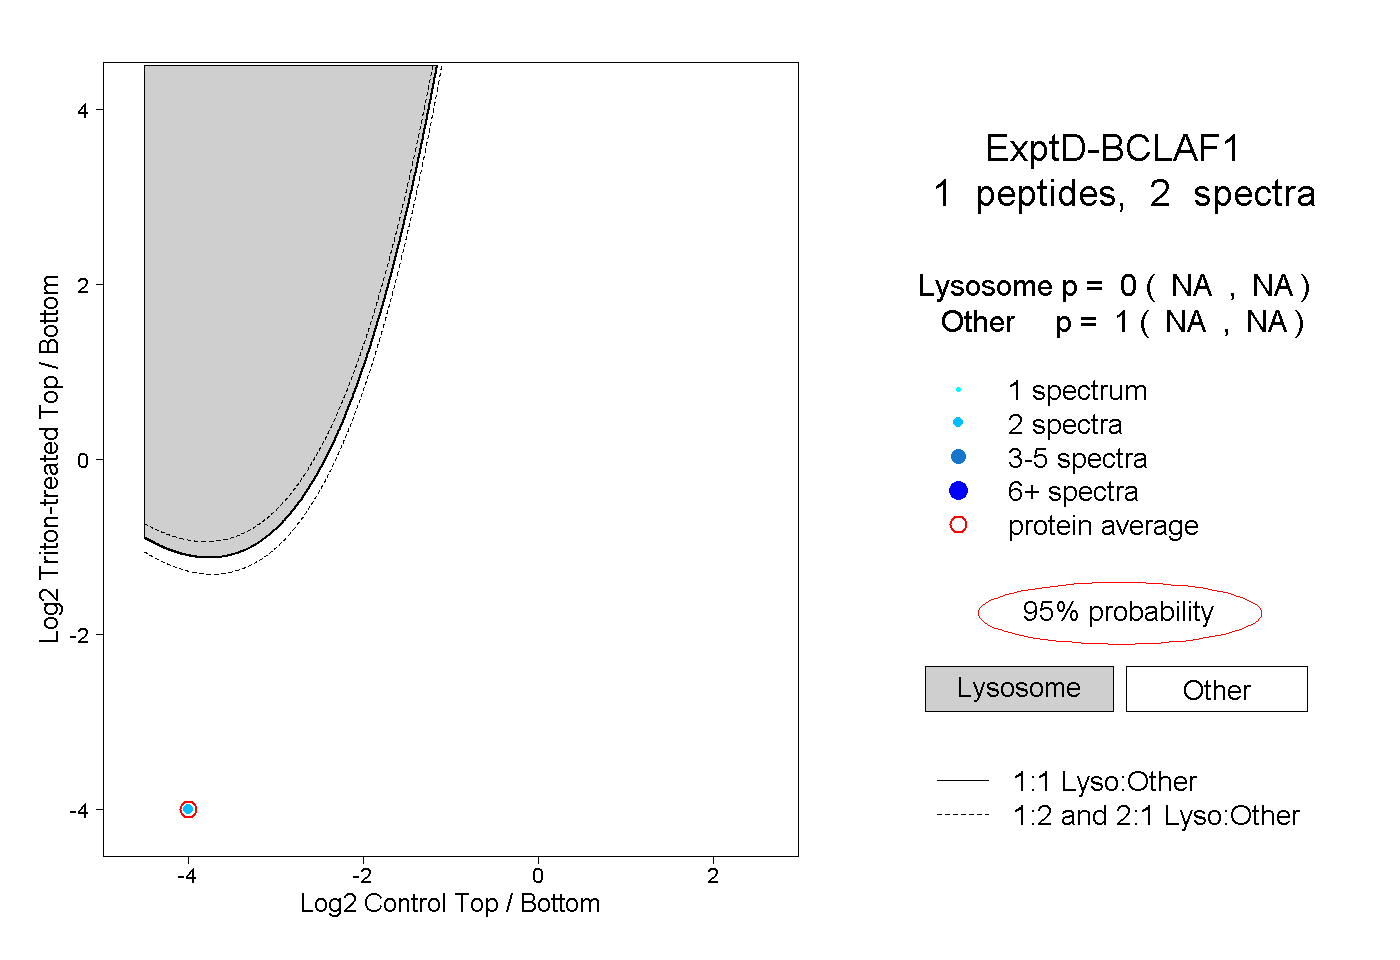 |
0.000 NA | NA |
1.000 NA | NA |