 1
1peptide
spectrum
NA | NA
NA | NA
NA | NA
NA | NA
NA | NA
NA | NA
NA | NA
| Plot | Mito | Lyso or Perox | ER | Golgi | PM | Cytosol | Nucleus | ||||||
| Expt B |
1 peptide |
1 spectrum |
|
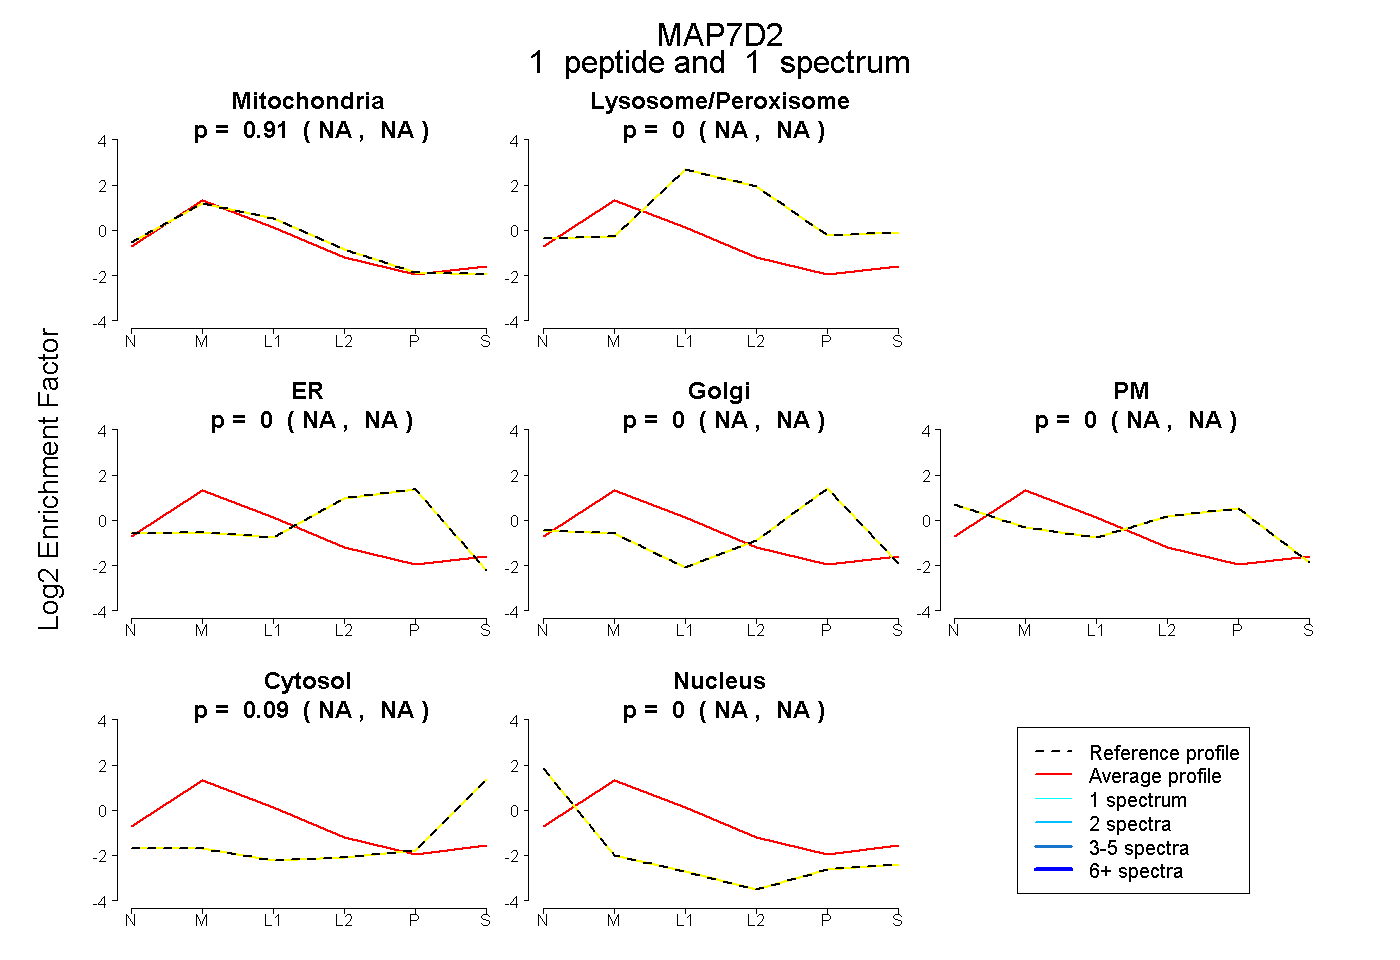
0.912 NA | NA |
0.000 NA | NA |
0.000 NA | NA |
0.000 NA | NA |
0.000 NA | NA |
0.088 NA | NA |
0.000 NA | NA |
| 1 spectrum, EQIMLQIEQER | 0.912 | 0.000 | 0.000 | 0.000 | 0.000 | 0.088 | 0.000 |