 3
3peptides
spectra
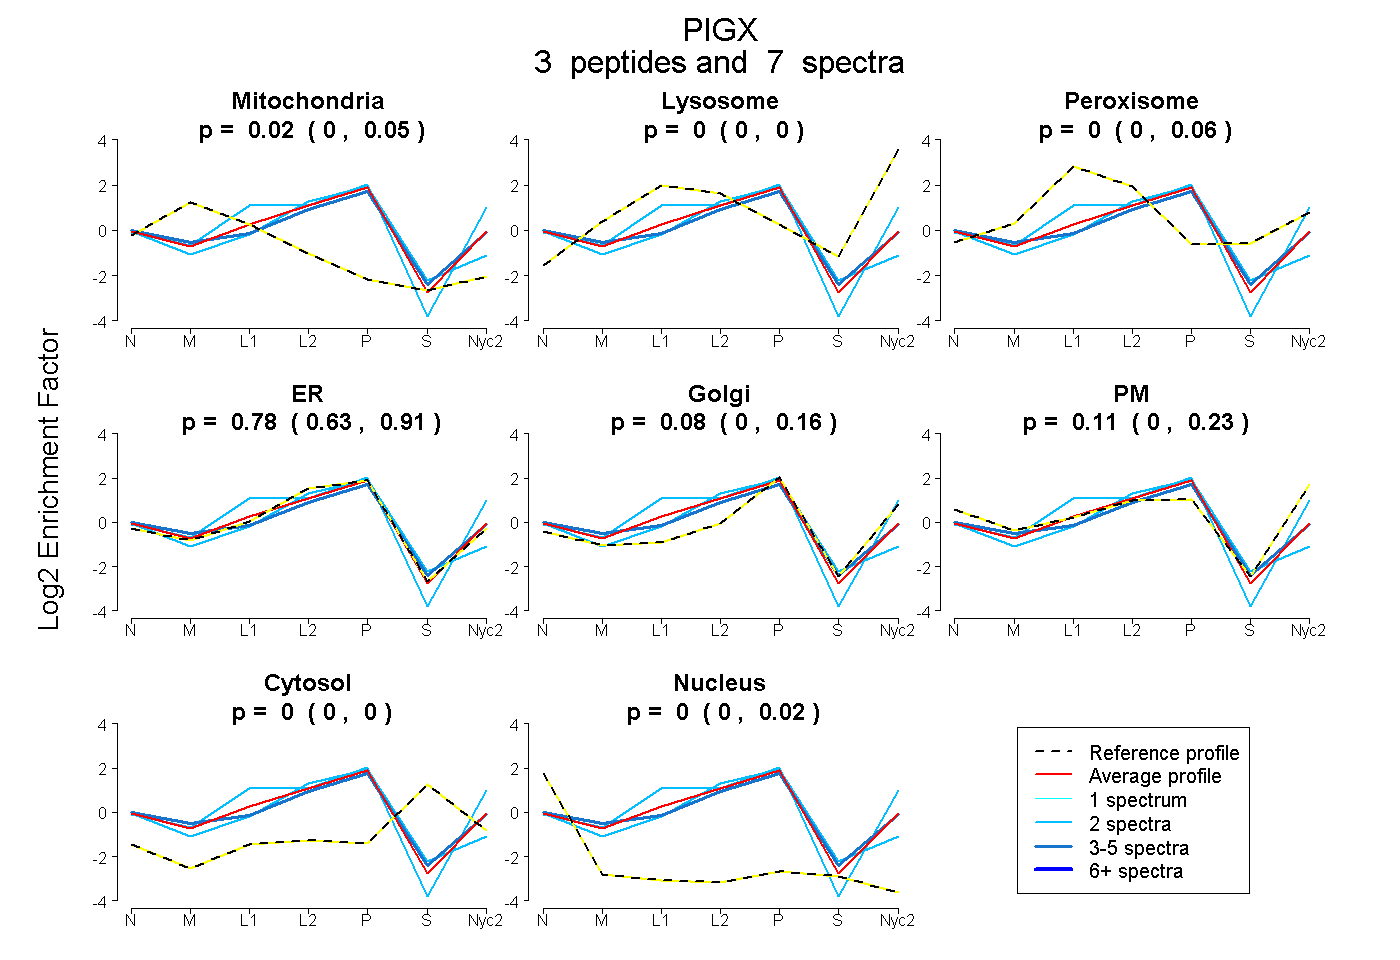
0.000 | 0.046
0.000 | 0.000
0.000 | 0.057
0.627 | 0.907
0.000 | 0.162
0.000 | 0.227
0.000 | 0.000
0.000 | 0.024
| Plot | Mito | Lyso | Perox | ER | Golgi | PM | Cytosol | Nucleus | |||||
| Expt A |
3 peptides |
7 spectra |
|
0.024 0.000 | 0.046 |
0.000 0.000 | 0.000 |
0.000 0.000 | 0.057 |
0.784 0.627 | 0.907 |
0.077 0.000 | 0.162 |
0.114 0.000 | 0.227 |
0.000 0.000 | 0.000 |
0.000 0.000 | 0.024 |
| 3 spectra, SEEICQWK | 0.070 | 0.000 | 0.000 | 0.629 | 0.213 | 0.088 | 0.000 | 0.000 | ||
| 2 spectra, FGESIEDLQTCR | 0.000 | 0.000 | 0.000 | 0.910 | 0.000 | 0.000 | 0.029 | 0.061 | ||
| 2 spectra, ATCSEIILR | 0.000 | 0.043 | 0.000 | 0.545 | 0.000 | 0.412 | 0.000 | 0.000 |