15
15peptides
spectra
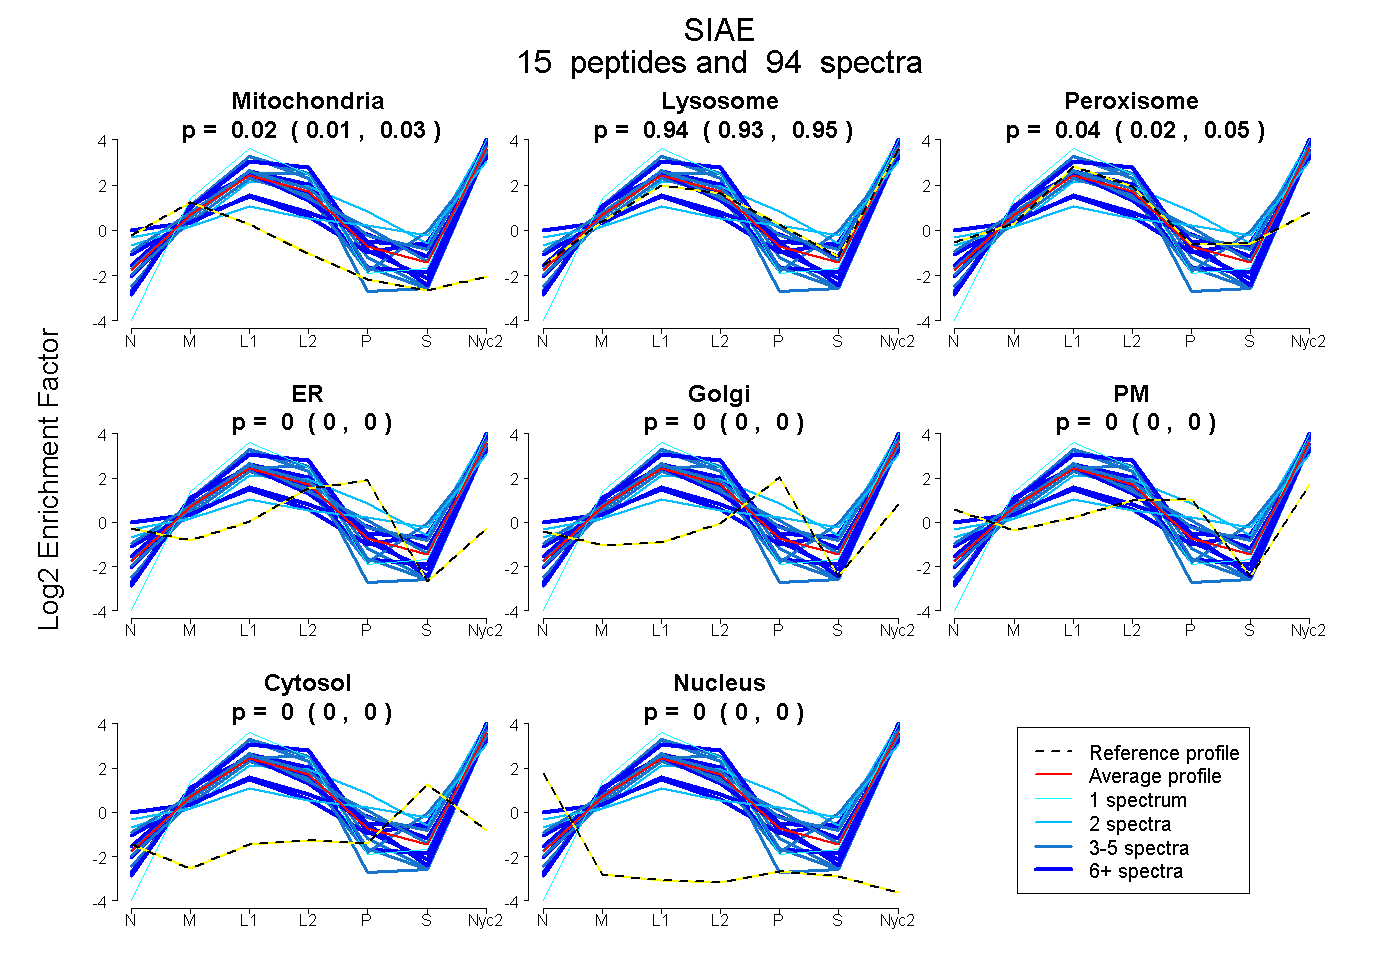
0.013 | 0.026
0.932 | 0.951
0.022 | 0.050
0.000 | 0.000
0.000 | 0.000
0.000 | 0.000
0.000 | 0.000
0.000 | 0.000
9peptides
spectra
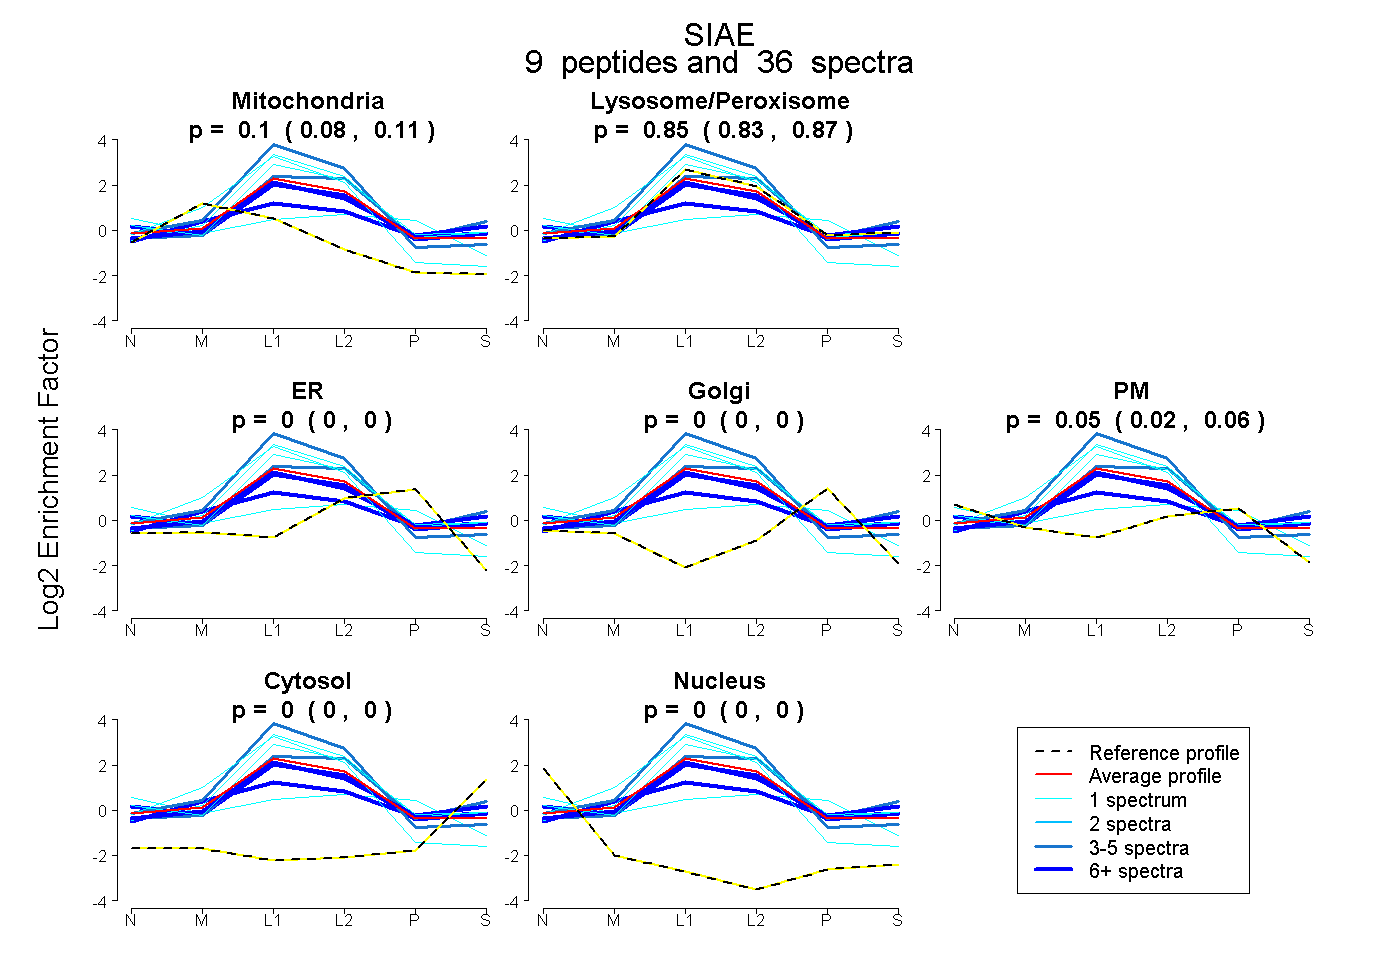
0.085 | 0.111
0.833 | 0.874
0.000 | 0.000
0.000 | 0.000
0.023 | 0.064
0.000 | 0.000
0.000 | 0.000