 15
15peptides
spectra
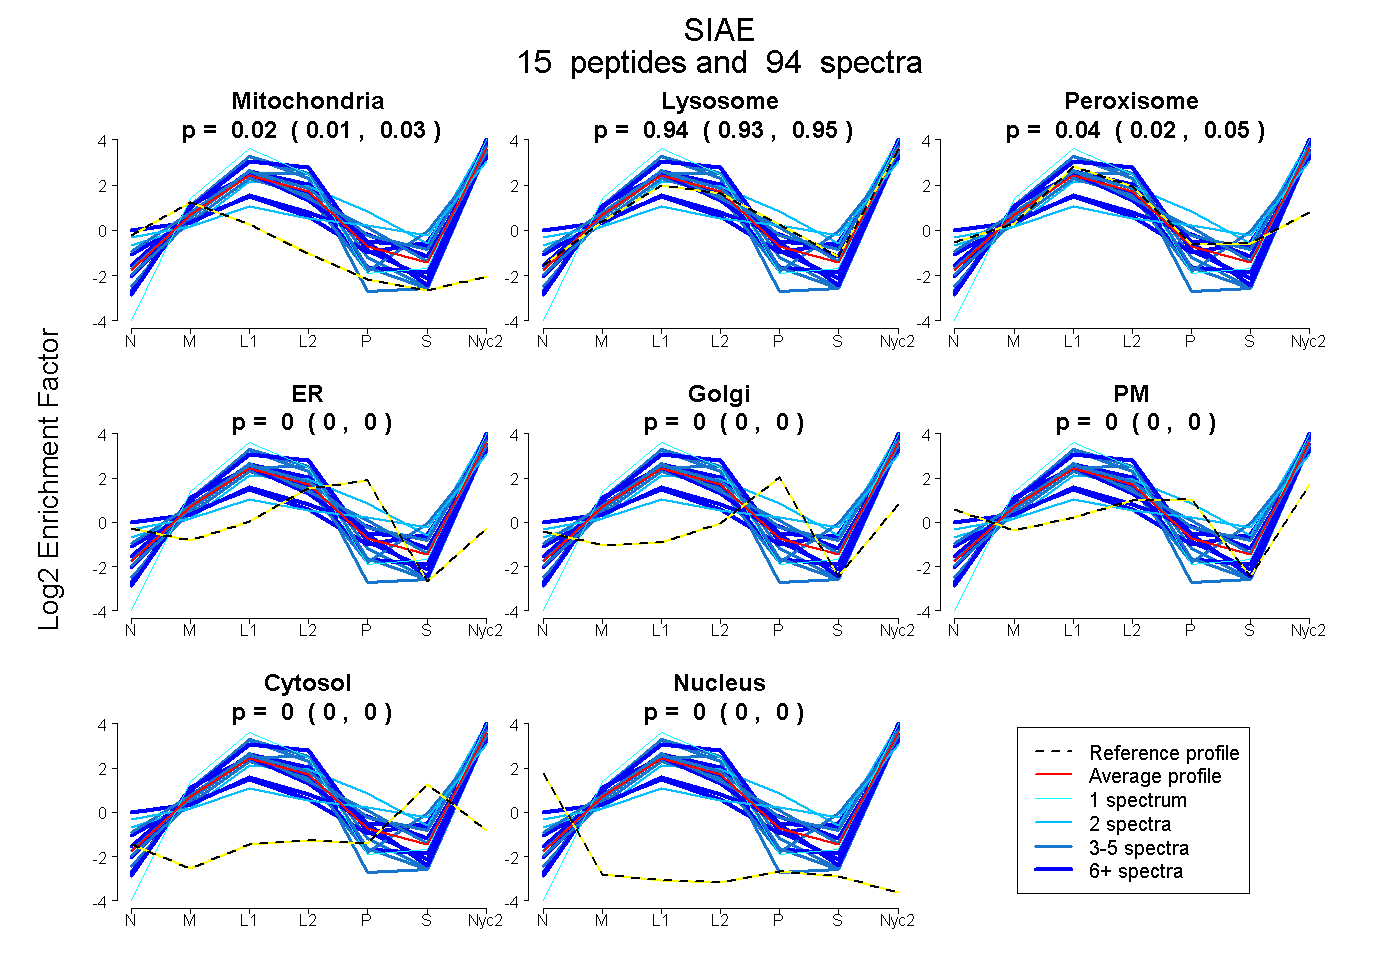
0.013 | 0.026
0.932 | 0.951
0.022 | 0.050
0.000 | 0.000
0.000 | 0.000
0.000 | 0.000
0.000 | 0.000
0.000 | 0.000
| Plot | Mito | Lyso | Perox | ER | Golgi | PM | Cytosol | Nucleus | |||||
| Expt A |
15 peptides |
94 spectra |
|
0.020 0.013 | 0.026 |
0.942 0.932 | 0.951 |
0.037 0.022 | 0.050 |
0.000 0.000 | 0.000 |
0.000 0.000 | 0.000 |
0.000 0.000 | 0.000 |
0.000 0.000 | 0.000 |
0.000 0.000 | 0.000 |
| 4 spectra, TFEISCCSDHQCK | 0.000 | 0.950 | 0.050 | 0.000 | 0.000 | 0.000 | 0.000 | 0.000 | ||
| 8 spectra, QCAVYHTSSVLPAPPFTAR | 0.085 | 0.915 | 0.000 | 0.000 | 0.000 | 0.000 | 0.000 | 0.000 | ||
| 3 spectra, GVVWYQGENNANYNR | 0.063 | 0.937 | 0.000 | 0.000 | 0.000 | 0.000 | 0.000 | 0.000 | ||
| 5 spectra, DLYACMFPALIADWR | 0.000 | 0.970 | 0.030 | 0.000 | 0.000 | 0.000 | 0.000 | 0.000 | ||
| 2 spectra, LELLAR | 0.000 | 0.968 | 0.000 | 0.000 | 0.000 | 0.032 | 0.000 | 0.000 | ||
| 2 spectra, WHQTADFGSVPNPK | 0.000 | 0.669 | 0.000 | 0.000 | 0.000 | 0.169 | 0.162 | 0.000 | ||
| 3 spectra, QTVAYR | 0.000 | 0.872 | 0.128 | 0.000 | 0.000 | 0.000 | 0.000 | 0.000 | ||
| 1 spectrum, YAWTTWPCEYK | 0.000 | 1.000 | 0.000 | 0.000 | 0.000 | 0.000 | 0.000 | 0.000 | ||
| 18 spectra, QTFHSGSQGQTER | 0.000 | 0.763 | 0.004 | 0.000 | 0.000 | 0.168 | 0.000 | 0.065 | ||
| 7 spectra, FASYIDNYMVLQK | 0.038 | 0.962 | 0.000 | 0.000 | 0.000 | 0.000 | 0.000 | 0.000 | ||
| 21 spectra, ELSDTAAYQSVR | 0.000 | 0.953 | 0.047 | 0.000 | 0.000 | 0.000 | 0.000 | 0.000 | ||
| 7 spectra, LHLGAR | 0.000 | 1.000 | 0.000 | 0.000 | 0.000 | 0.000 | 0.000 | 0.000 | ||
| 7 spectra, DSPFGSIHPR | 0.070 | 0.805 | 0.000 | 0.000 | 0.000 | 0.000 | 0.125 | 0.000 | ||
| 3 spectra, AVAYGEK | 0.040 | 0.960 | 0.000 | 0.000 | 0.000 | 0.000 | 0.000 | 0.000 | ||
| 3 spectra, MPNTFMAVAMDLCDR | 0.000 | 0.713 | 0.215 | 0.000 | 0.000 | 0.000 | 0.072 | 0.000 |
| Plot | Mito | Lyso or Perox | ER | Golgi | PM | Cytosol | Nucleus | ||||||
| Expt B |
9 peptides |
36 spectra |
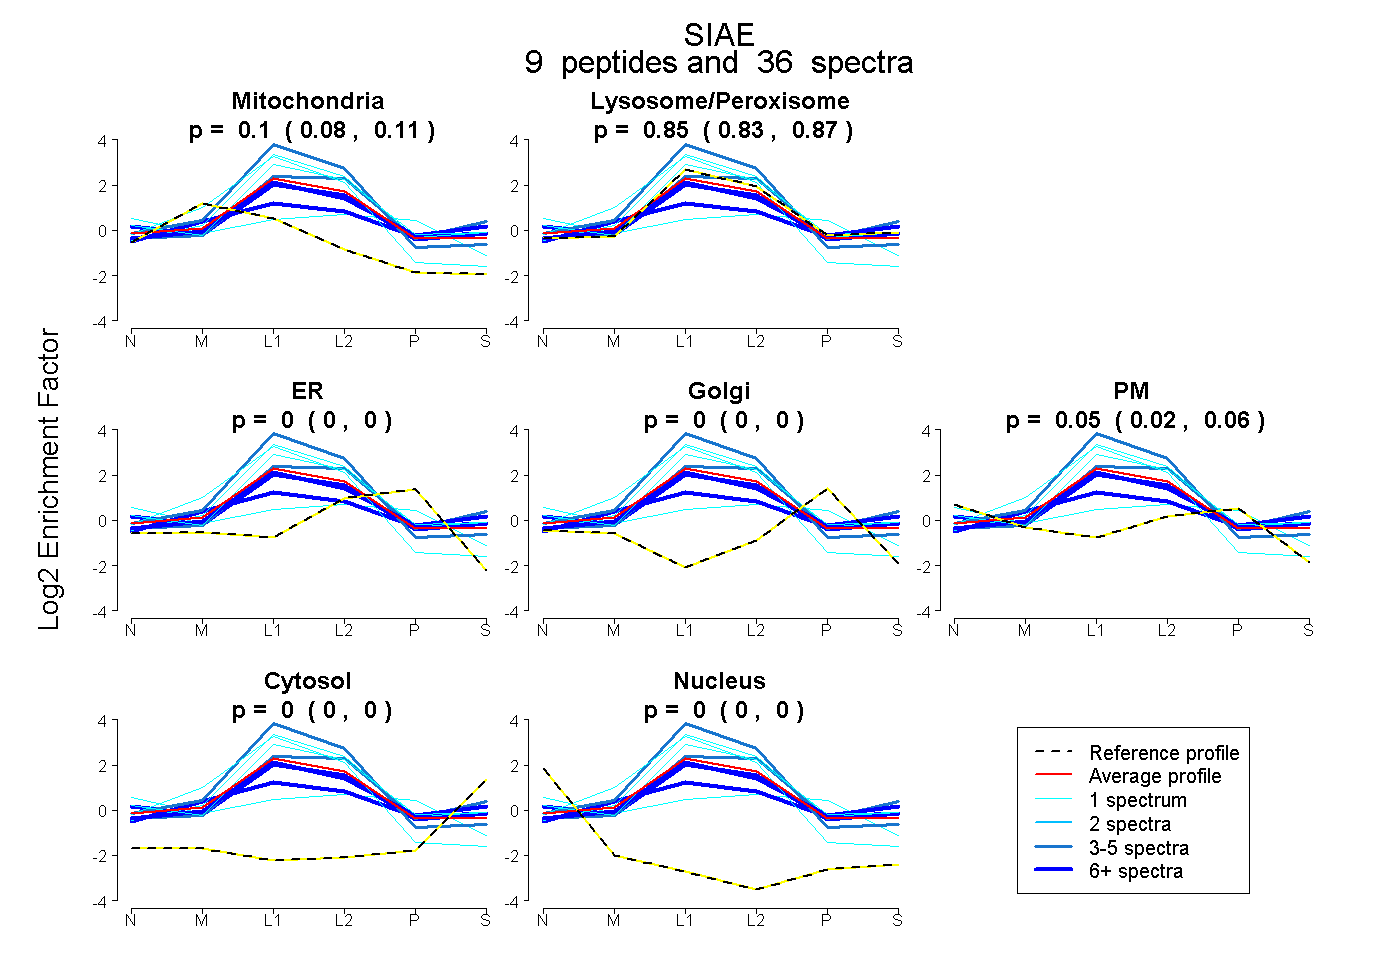 |
0.099 0.085 | 0.111 |
0.855 0.833 | 0.874 |
0.000 0.000 | 0.000 |
0.000 0.000 | 0.000 |
0.046 0.023 | 0.064 |
0.000 0.000 | 0.000 |
0.000 0.000 | 0.000 |
|||
| Plot | Lyso | Other | |||||||||||
| Expt C |
15 peptides |
266 spectra |
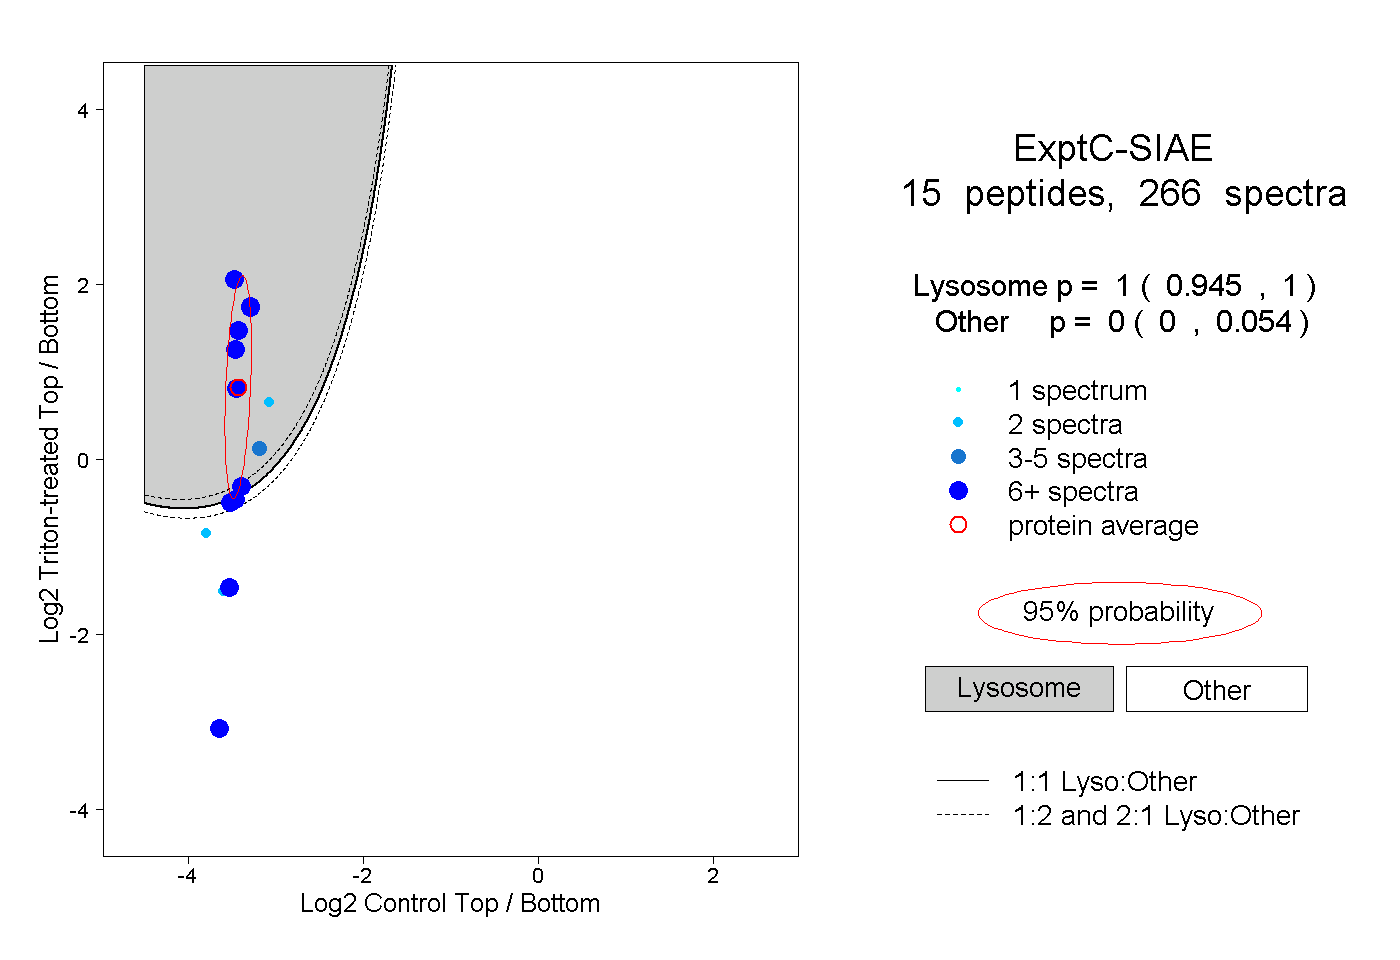 |
1.000 0.945 | 1.000 |
0.000 0.000 | 0.054 |
||||||||
| Plot | Lyso | Other | |||||||||||
| Expt D |
8 peptides |
16 spectra |
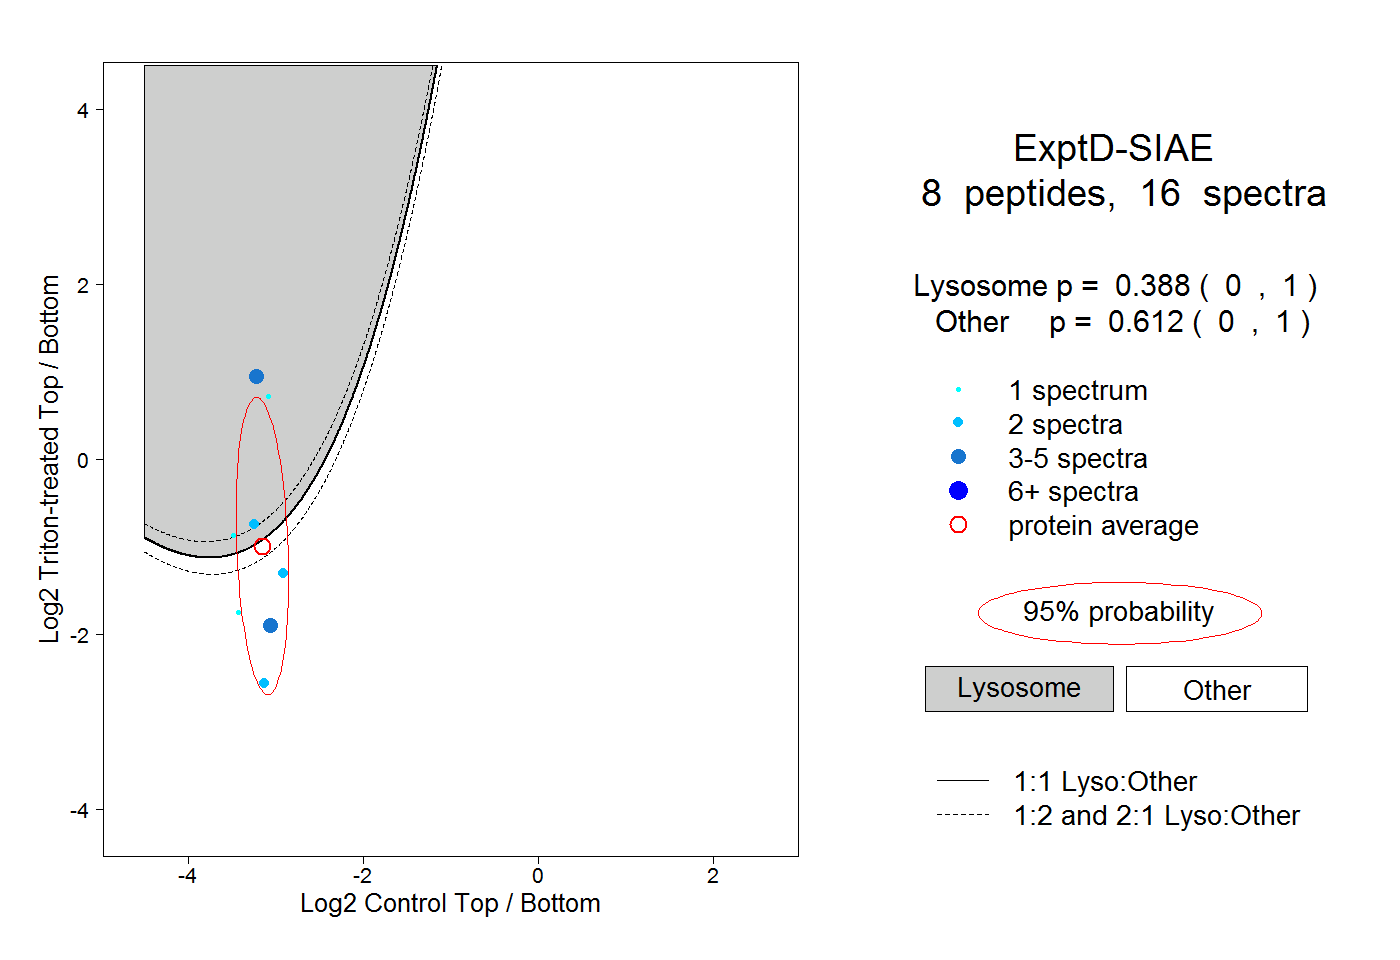 |
0.388 0.000 | 1.000 |
0.612 0.000 | 1.000 |