 3
3peptides
spectra

0.000 | 0.000
0.000 | 0.000
0.000 | 0.000
0.000 | 0.000
0.184 | 0.212
0.000 | 0.000
0.000 | 0.012
0.782 | 0.809
1peptide
spectra
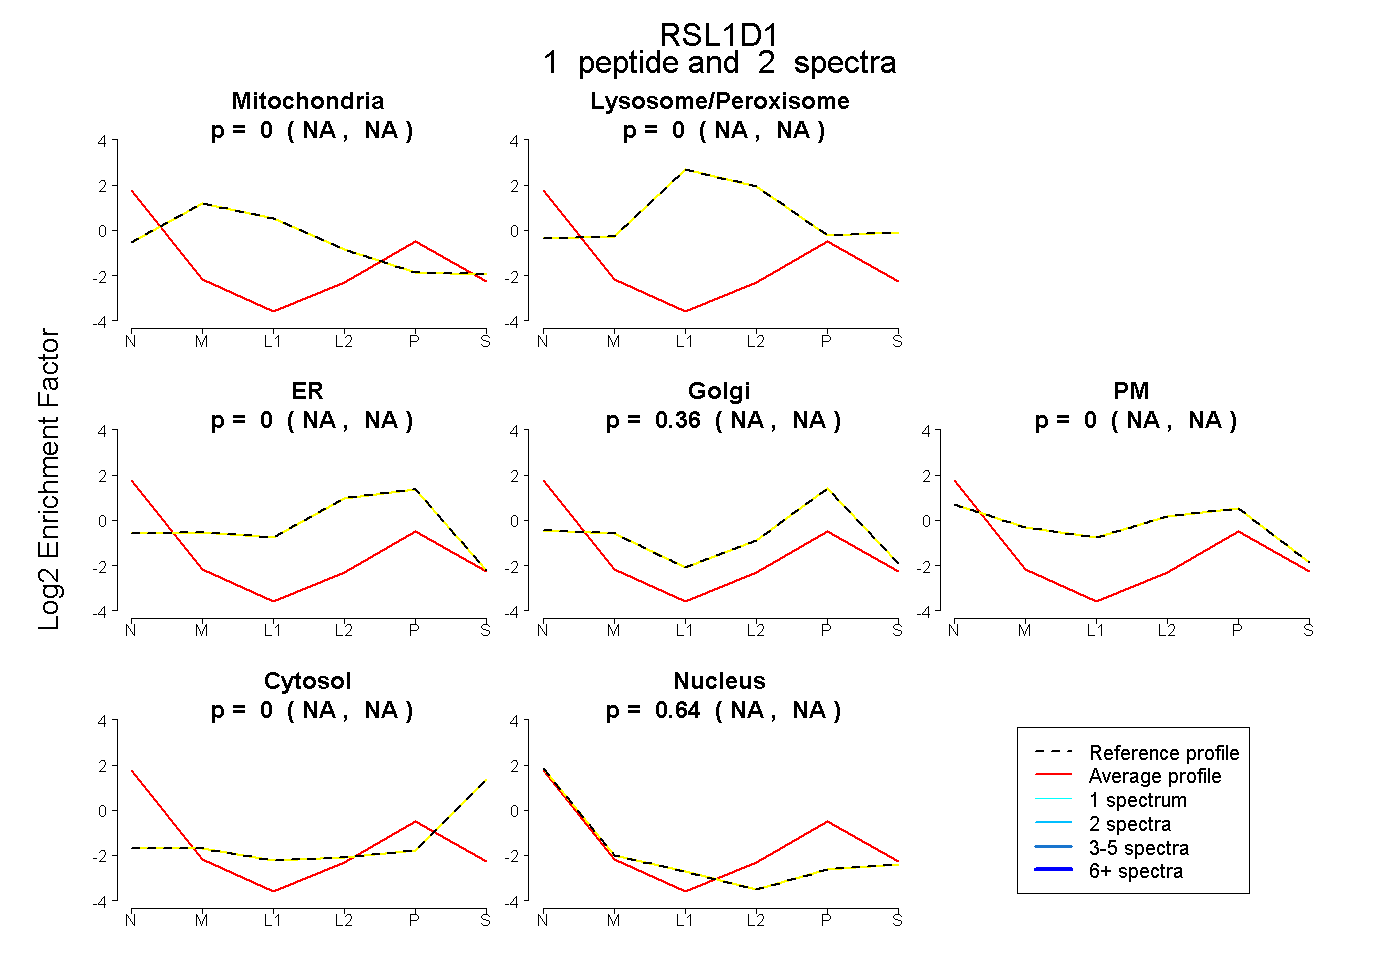
NA | NA
NA | NA
NA | NA
NA | NA
NA | NA
NA | NA
NA | NA
1peptide
spectra
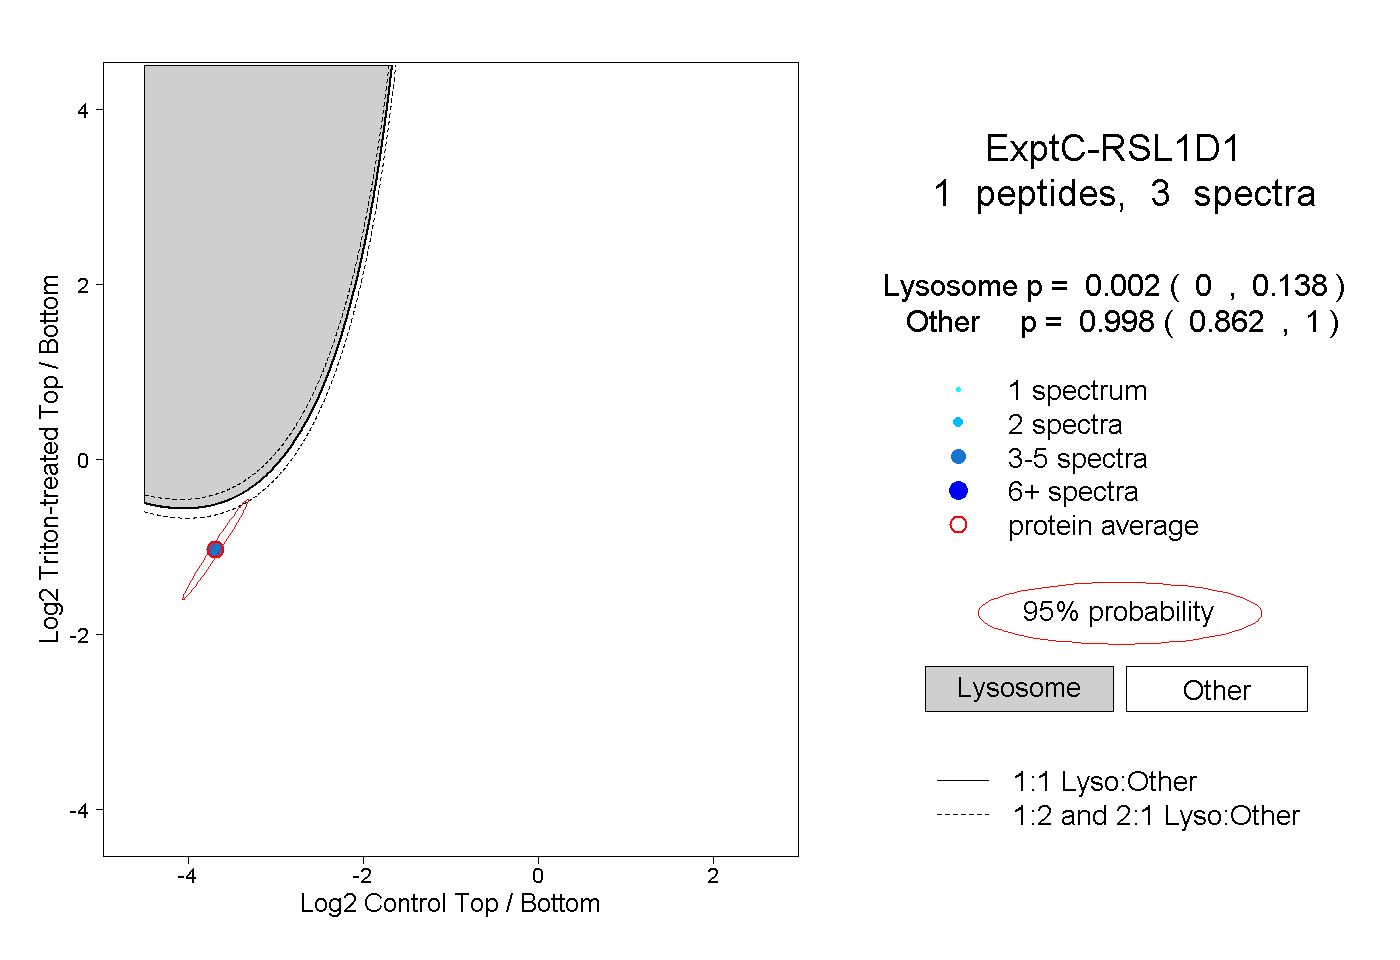
0.000 | 0.138
0.862 | 1.000