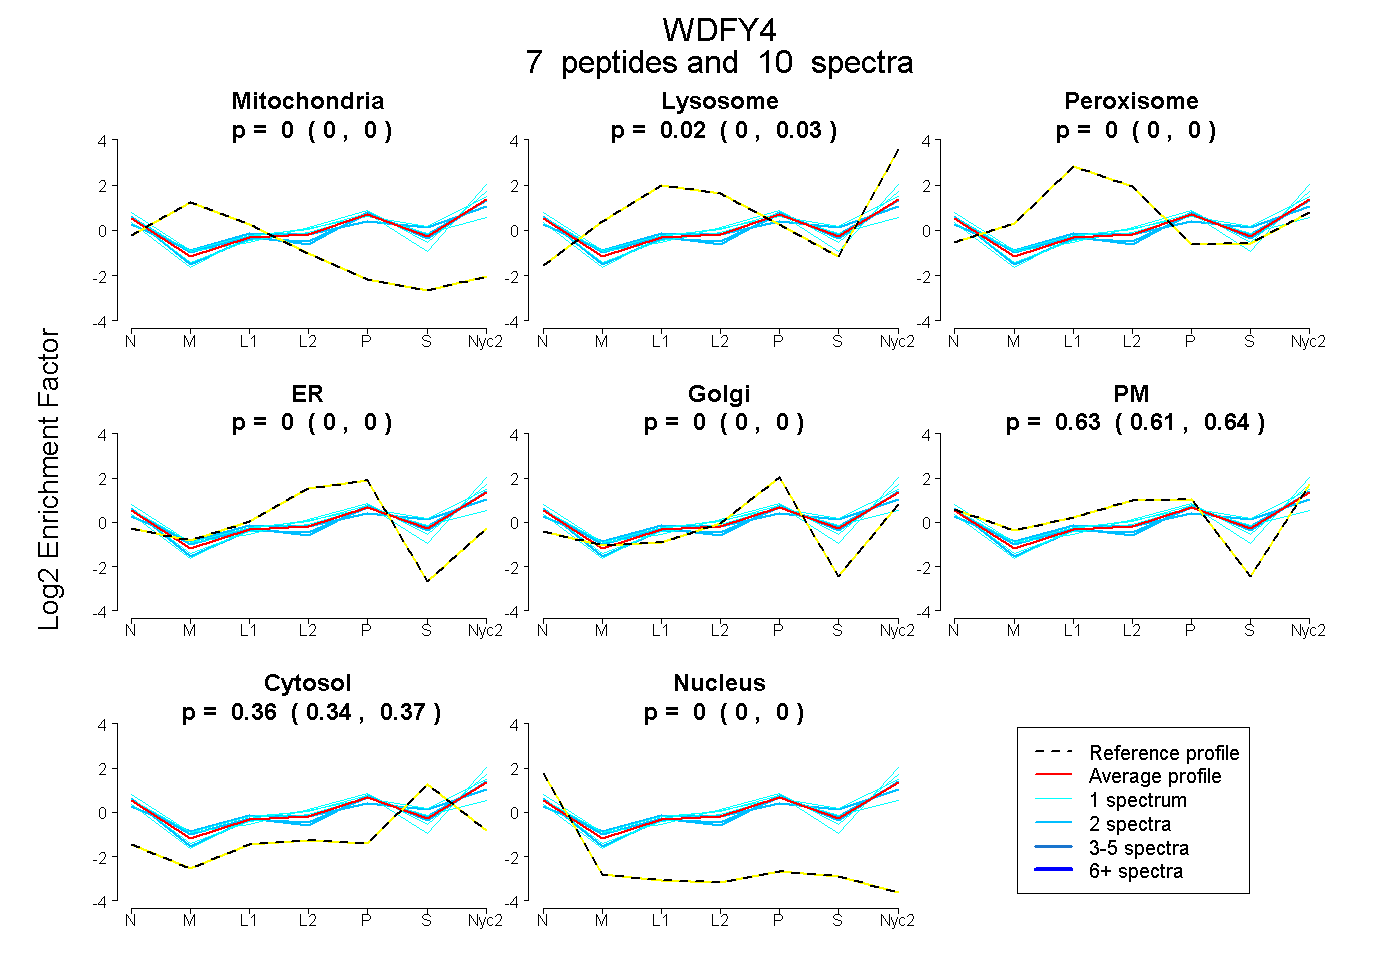
 7
7peptides
spectra
0.000 | 0.000
0.000 | 0.034
0.000 | 0.000
0.000 | 0.000
0.000 | 0.000
0.607 | 0.642
0.343 | 0.365
0.000 | 0.000
| Plot | Mito | Lyso | Perox | ER | Golgi | PM | Cytosol | Nucleus | |||||
| Expt A |
7 peptides |
10 spectra |
|
0.000 0.000 | 0.000 |
0.019 0.000 | 0.034 |
0.000 0.000 | 0.000 |
0.000 0.000 | 0.000 |
0.000 0.000 | 0.000 |
0.625 0.607 | 0.642 |
0.355 0.343 | 0.365 |
0.000 0.000 | 0.000 |
| 1 spectrum, IFLDDECYR | 0.000 | 0.000 | 0.000 | 0.000 | 0.001 | 0.574 | 0.425 | 0.000 | ||
| 2 spectra, ASPAVTALAVTR | 0.000 | 0.000 | 0.000 | 0.000 | 0.000 | 0.603 | 0.397 | 0.000 | ||
| 1 spectrum, FLTLVR | 0.000 | 0.039 | 0.000 | 0.000 | 0.000 | 0.751 | 0.210 | 0.000 | ||
| 2 spectra, AIMSQPR | 0.000 | 0.077 | 0.040 | 0.000 | 0.000 | 0.476 | 0.408 | 0.000 | ||
| 2 spectra, ALWQQLVAQR | 0.000 | 0.000 | 0.000 | 0.000 | 0.008 | 0.643 | 0.349 | 0.000 | ||
| 1 spectrum, LFTDIFR | 0.000 | 0.021 | 0.000 | 0.000 | 0.000 | 0.701 | 0.277 | 0.000 | ||
| 1 spectrum, NTYNEVDSR | 0.000 | 0.094 | 0.000 | 0.000 | 0.000 | 0.497 | 0.408 | 0.000 |
| Plot | Lyso | Other | |||||||||||
| Expt C |
3 peptides |
5 spectra |
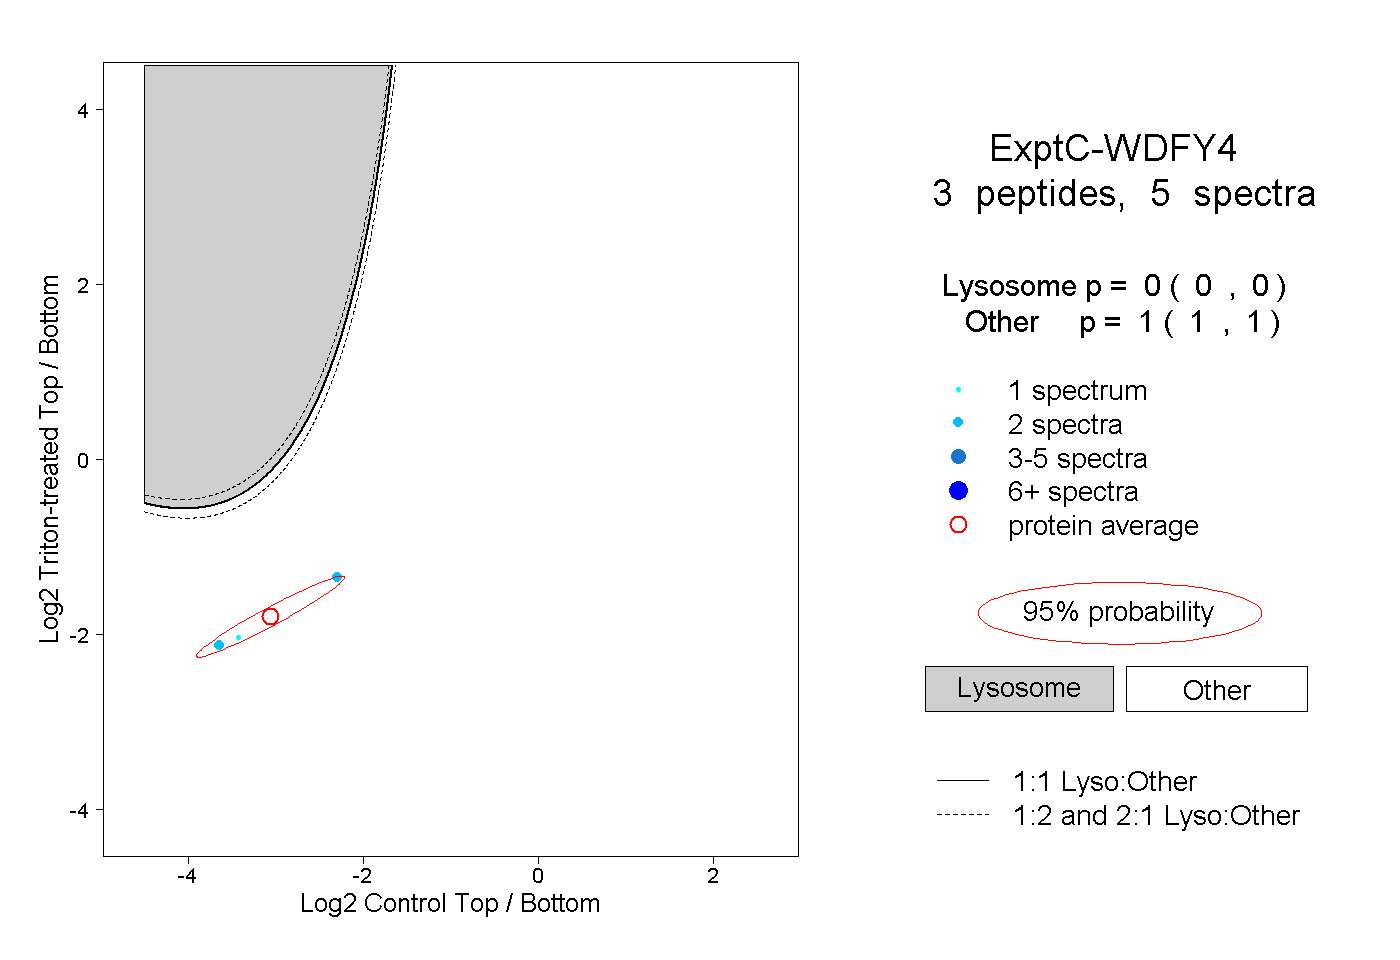 |
0.000 0.000 | 0.000 |
1.000 1.000 | 1.000 |