 26
26peptides
spectra
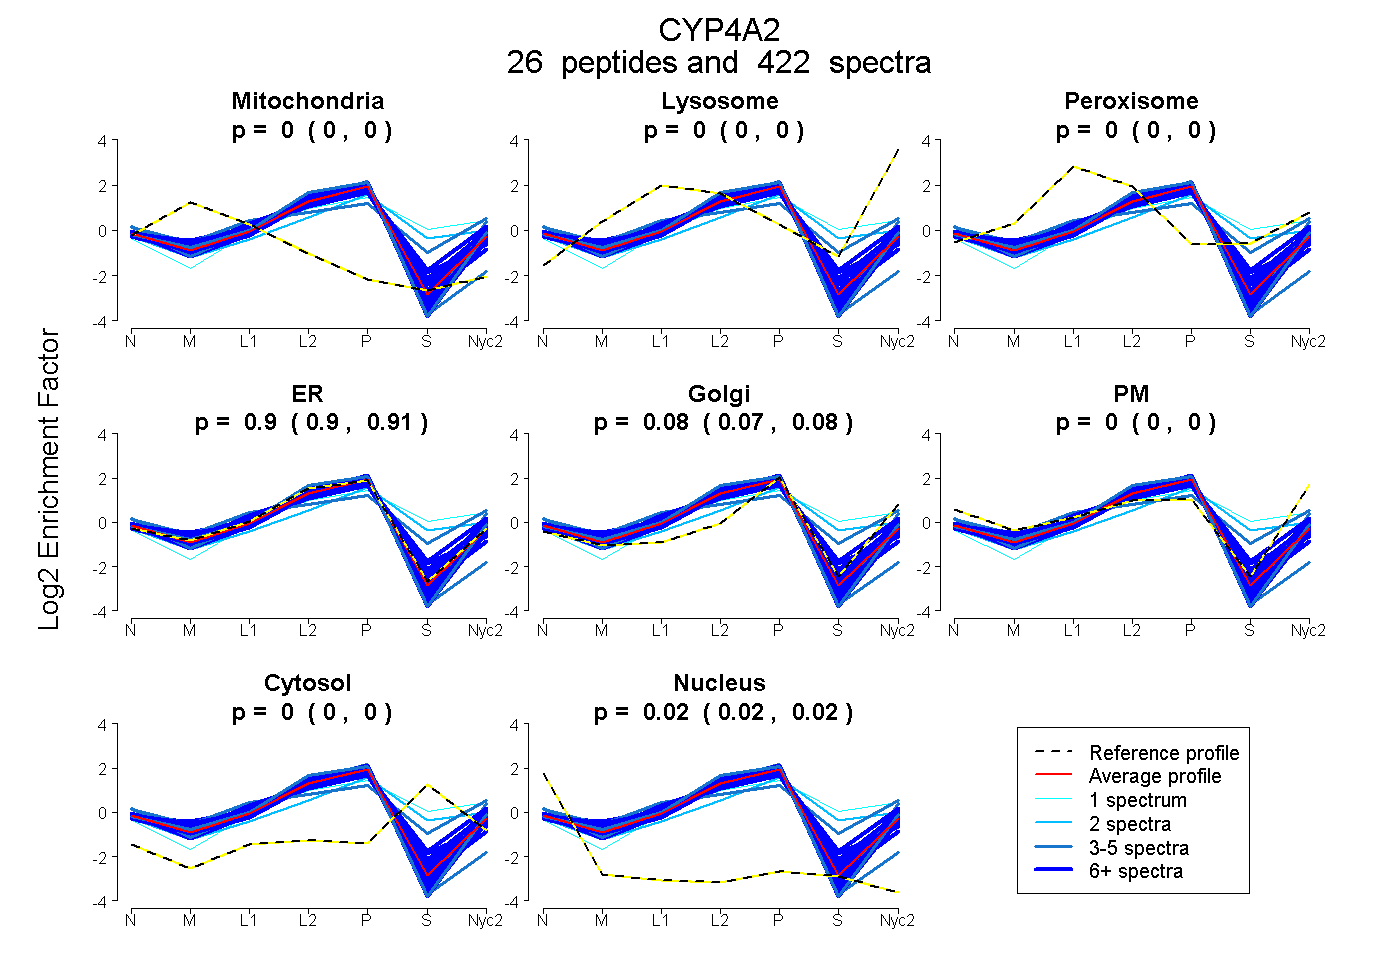
0.000 | 0.000
0.000 | 0.000
0.000 | 0.000
0.902 | 0.906
0.073 | 0.079
0.000 | 0.000
0.000 | 0.000
0.019 | 0.020
20peptides
spectra
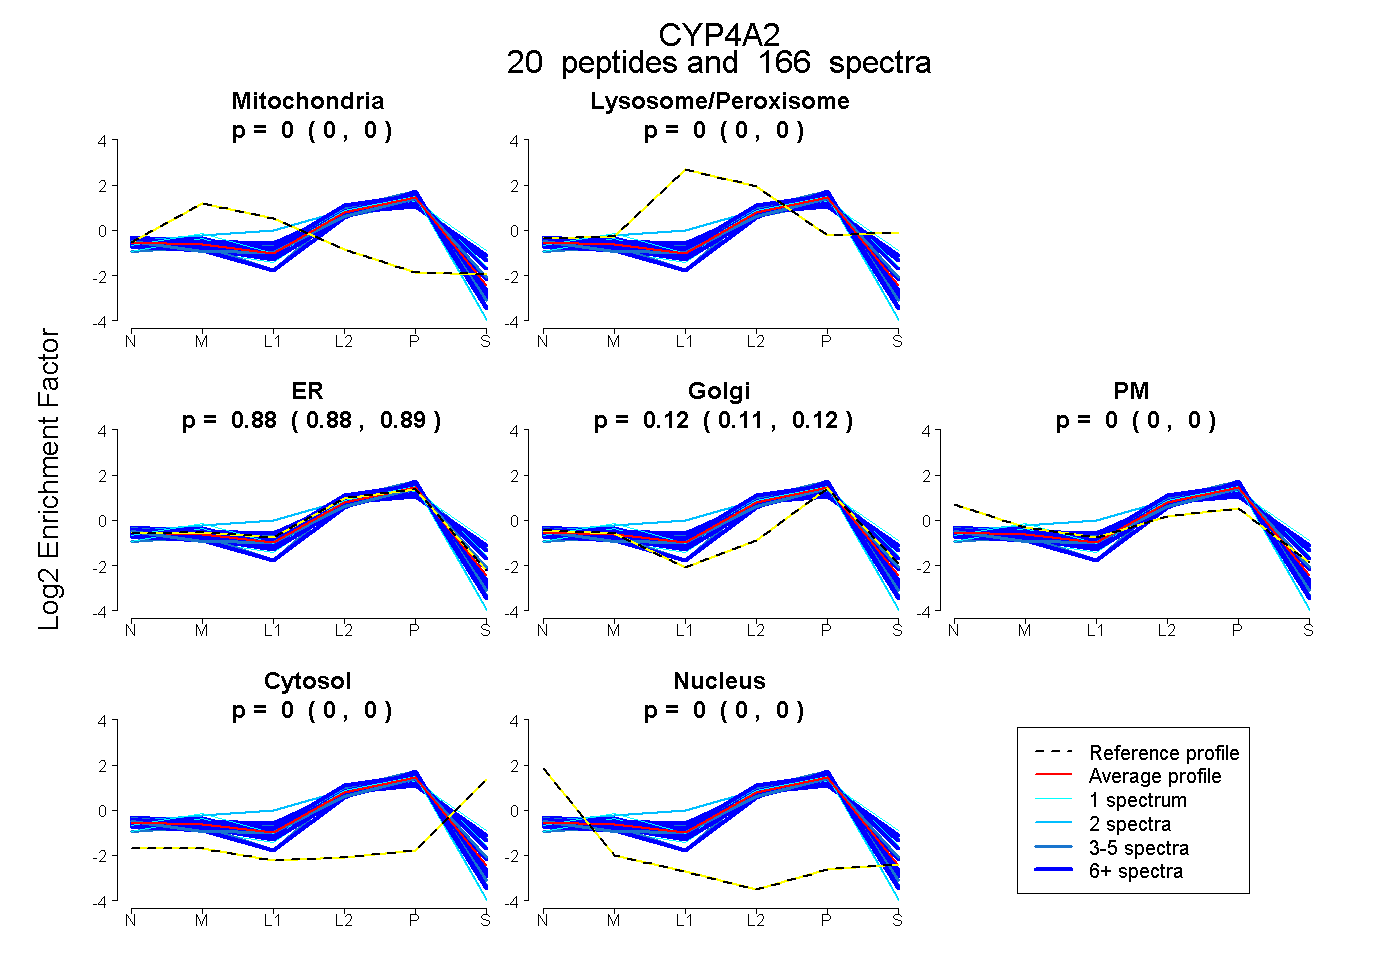
0.000 | 0.000
0.000 | 0.000
0.880 | 0.888
0.111 | 0.119
0.000 | 0.000
0.000 | 0.000
0.000 | 0.000
25peptides
spectra
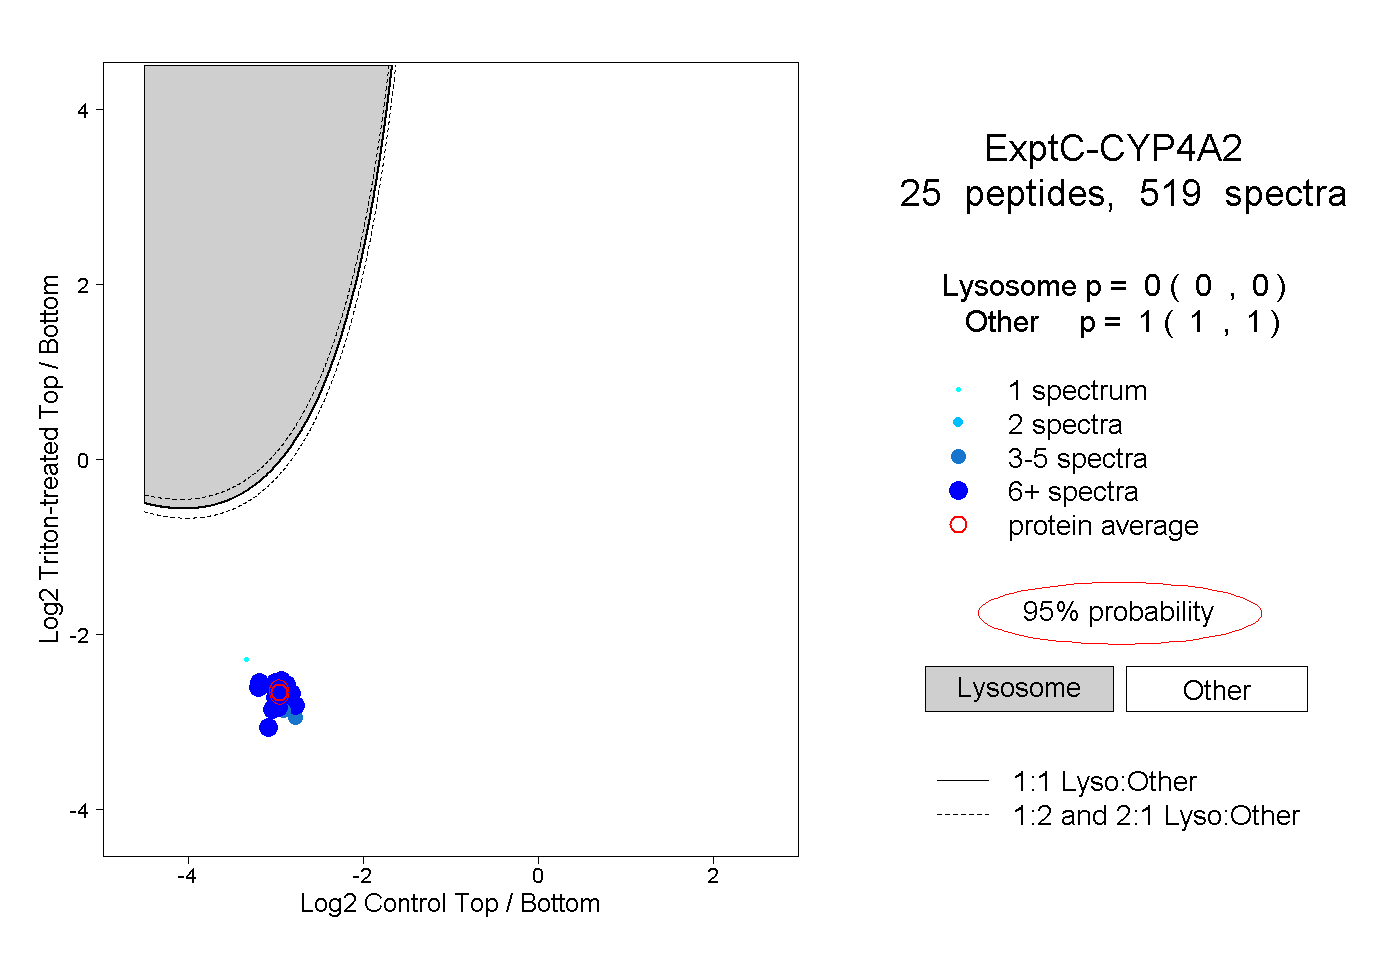
0.000 | 0.000
1.000 | 1.000
14peptides
spectra
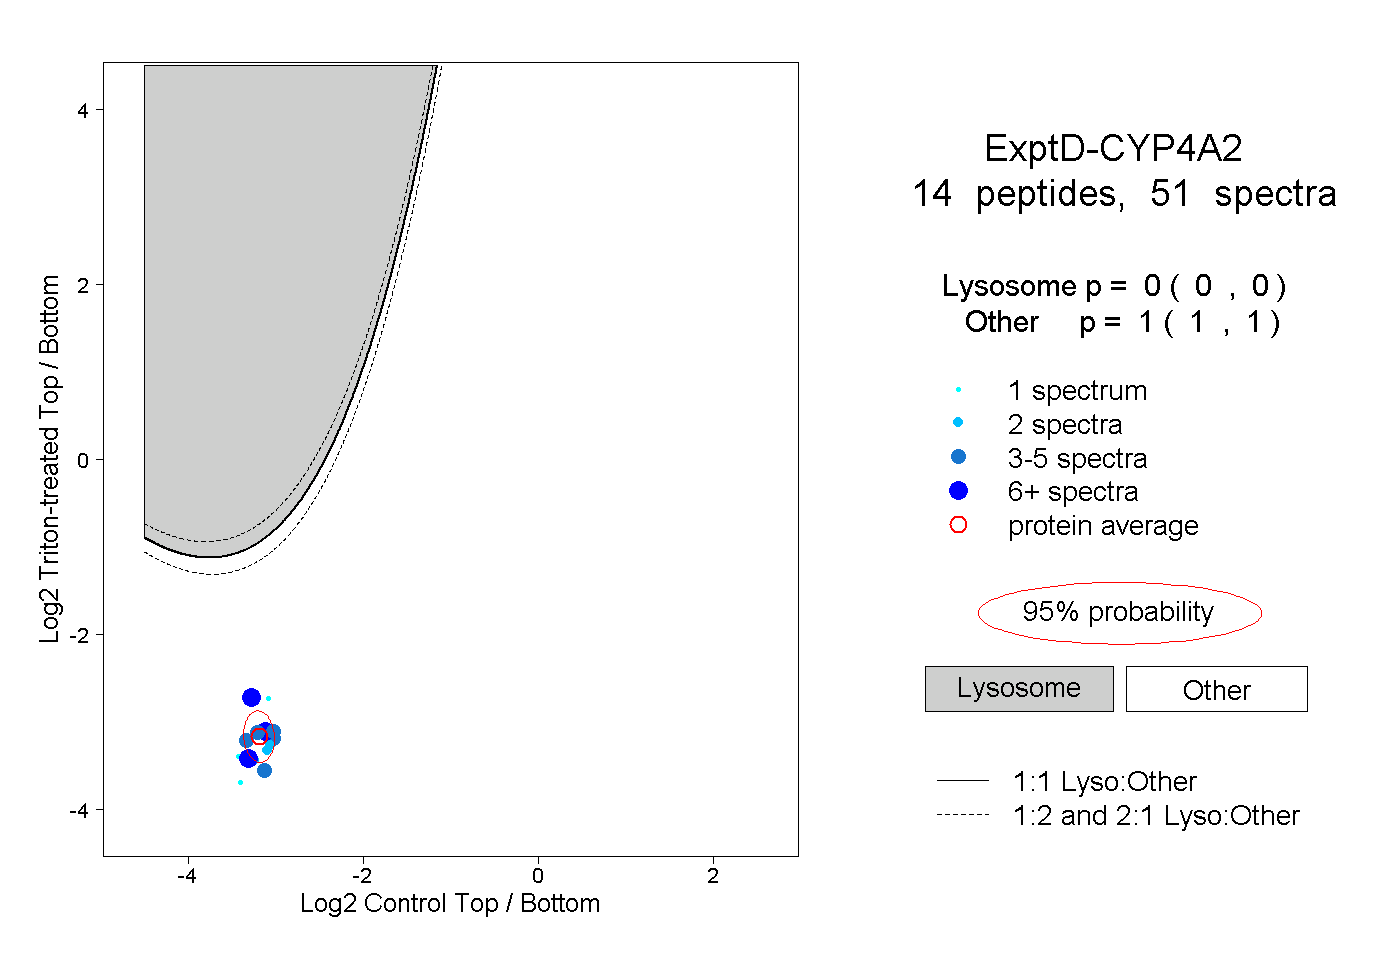
0.000 | 0.000
1.000 | 1.000