 26
26peptides
spectra
0.000 | 0.000
0.000 | 0.000
0.000 | 0.000
0.902 | 0.906
0.073 | 0.079
0.000 | 0.000
0.000 | 0.000
0.019 | 0.020
| Plot | Mito | Lyso | Perox | ER | Golgi | PM | Cytosol | Nucleus | |||||
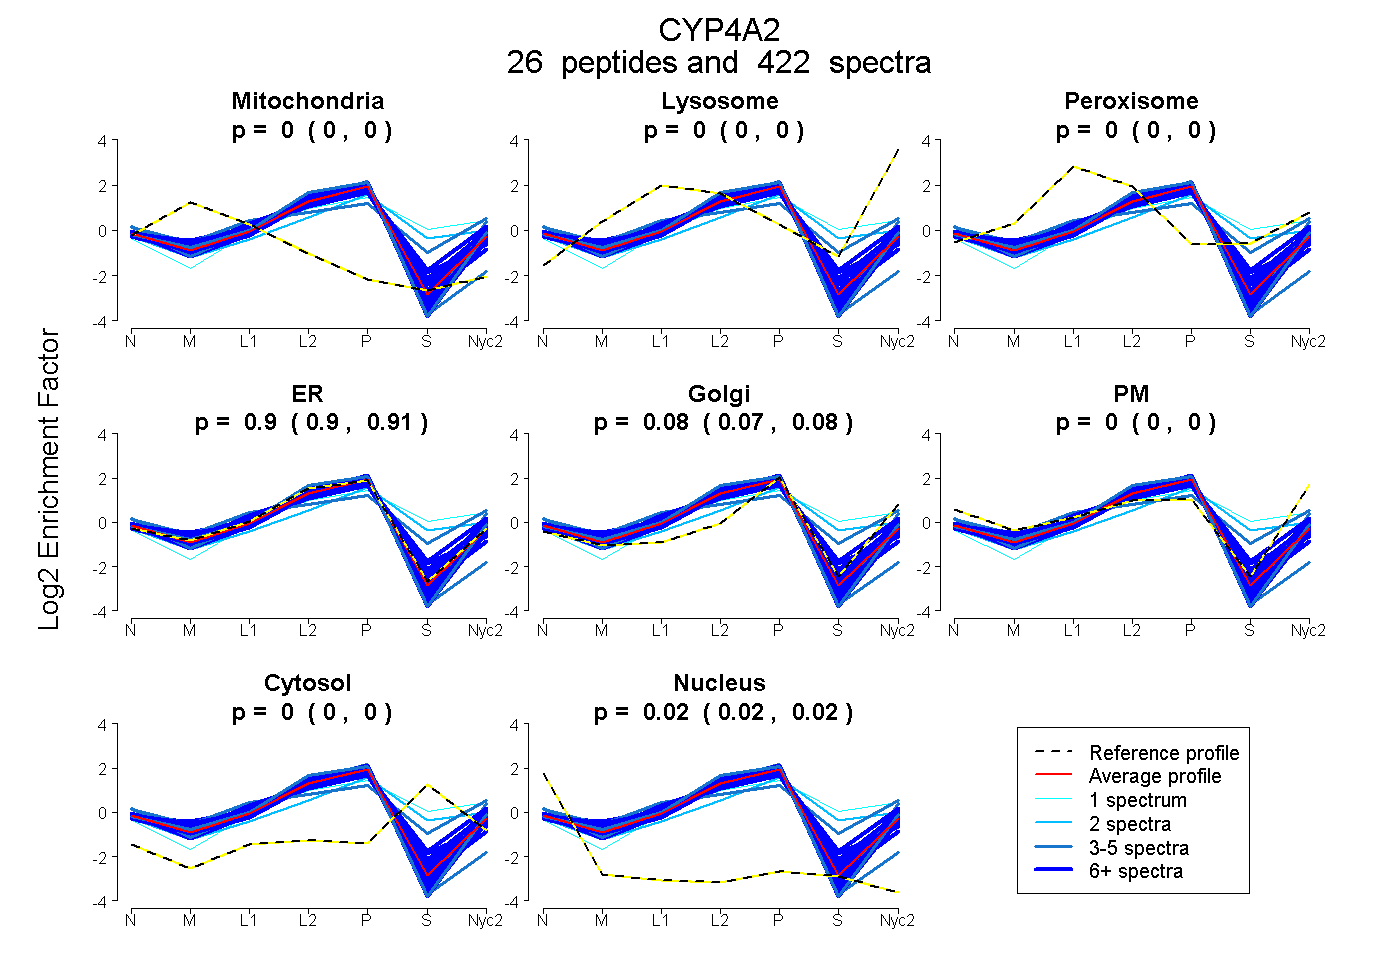
| Expt A |
26 peptides |
422 spectra |
|
0.000 0.000 | 0.000 |
0.000 0.000 | 0.000 |
0.000 0.000 | 0.000 |
0.904 0.902 | 0.906 |
0.076 0.073 | 0.079 |
0.000 0.000 | 0.000 |
0.000 0.000 | 0.000 |
0.020 0.019 | 0.020 |
| 11 spectra, FELLPDPTR | 0.000 | 0.000 | 0.000 | 0.912 | 0.070 | 0.000 | 0.000 | 0.019 | ||
| 11 spectra, ACQIAHEHTDGVIK | 0.000 | 0.000 | 0.000 | 0.956 | 0.000 | 0.000 | 0.000 | 0.044 | ||
| 5 spectra, FPGACLQWLSGSTAR | 0.000 | 0.000 | 0.000 | 0.908 | 0.000 | 0.000 | 0.000 | 0.092 | ||
| 24 spectra, ELSSPVTFPDGR | 0.000 | 0.000 | 0.000 | 0.945 | 0.012 | 0.000 | 0.000 | 0.043 | ||
| 8 spectra, SAFYGNSIIYNMSSDGR | 0.000 | 0.000 | 0.106 | 0.733 | 0.137 | 0.000 | 0.023 | 0.000 | ||
| 10 spectra, QFAMNELK | 0.046 | 0.000 | 0.000 | 0.875 | 0.065 | 0.013 | 0.000 | 0.000 | ||
| 27 spectra, IPVPMAR | 0.000 | 0.000 | 0.000 | 0.948 | 0.033 | 0.000 | 0.000 | 0.019 | ||
| 20 spectra, FSPDSPR | 0.000 | 0.000 | 0.000 | 0.921 | 0.040 | 0.000 | 0.000 | 0.038 | ||
| 18 spectra, AQLQNEEELQK | 0.000 | 0.000 | 0.000 | 0.844 | 0.036 | 0.038 | 0.082 | 0.000 | ||
| 24 spectra, GFSVFSPTR | 0.000 | 0.000 | 0.000 | 0.942 | 0.036 | 0.000 | 0.000 | 0.022 | ||
| 19 spectra, VAVALTLLR | 0.000 | 0.000 | 0.000 | 0.956 | 0.000 | 0.042 | 0.000 | 0.002 | ||
| 34 spectra, VFDPSR | 0.000 | 0.000 | 0.000 | 0.869 | 0.121 | 0.000 | 0.000 | 0.009 | ||
| 10 spectra, VLLYDPDYVK | 0.000 | 0.000 | 0.000 | 0.732 | 0.117 | 0.115 | 0.034 | 0.002 | ||
| 26 spectra, CAFSHQGSVQLDVNSR | 0.000 | 0.000 | 0.052 | 0.847 | 0.000 | 0.000 | 0.101 | 0.000 | ||
| 16 spectra, AVEDLNNLIFFR | 0.000 | 0.000 | 0.000 | 0.921 | 0.054 | 0.000 | 0.000 | 0.026 | ||
| 11 spectra, NGIHLR | 0.000 | 0.085 | 0.021 | 0.777 | 0.000 | 0.047 | 0.070 | 0.000 | ||
| 61 spectra, SLSDEDLR | 0.000 | 0.000 | 0.000 | 0.885 | 0.092 | 0.000 | 0.000 | 0.023 | ||
| 3 spectra, MLTPAFHYDILKPYVK | 0.000 | 0.000 | 0.000 | 0.930 | 0.000 | 0.062 | 0.000 | 0.008 | ||
| 4 spectra, HSHAYLPFSGGAR | 0.000 | 0.000 | 0.273 | 0.162 | 0.268 | 0.186 | 0.112 | 0.000 | ||
| 3 spectra, WFQHR | 0.000 | 0.000 | 0.000 | 1.000 | 0.000 | 0.000 | 0.000 | 0.000 | ||
| 1 spectrum, AQLQDEEELQK | 0.000 | 0.166 | 0.000 | 0.485 | 0.006 | 0.000 | 0.344 | 0.000 | ||
| 12 spectra, EFQQVLTWVEK | 0.068 | 0.000 | 0.061 | 0.710 | 0.161 | 0.000 | 0.000 | 0.000 | ||
| 4 spectra, IMADSVSIMLDK | 0.000 | 0.000 | 0.000 | 0.768 | 0.120 | 0.112 | 0.000 | 0.000 | ||
| 46 spectra, LYSPVPSVSR | 0.000 | 0.000 | 0.000 | 0.925 | 0.074 | 0.000 | 0.000 | 0.001 | ||
| 2 spectra, AVQFYLR | 0.000 | 0.000 | 0.086 | 0.359 | 0.273 | 0.000 | 0.282 | 0.000 | ||
| 12 spectra, HLDFLDILLFAK | 0.000 | 0.000 | 0.000 | 0.977 | 0.000 | 0.000 | 0.000 | 0.023 |
| Plot | Mito | Lyso or Perox | ER | Golgi | PM | Cytosol | Nucleus | ||||||
| Expt B |
20 peptides |
166 spectra |
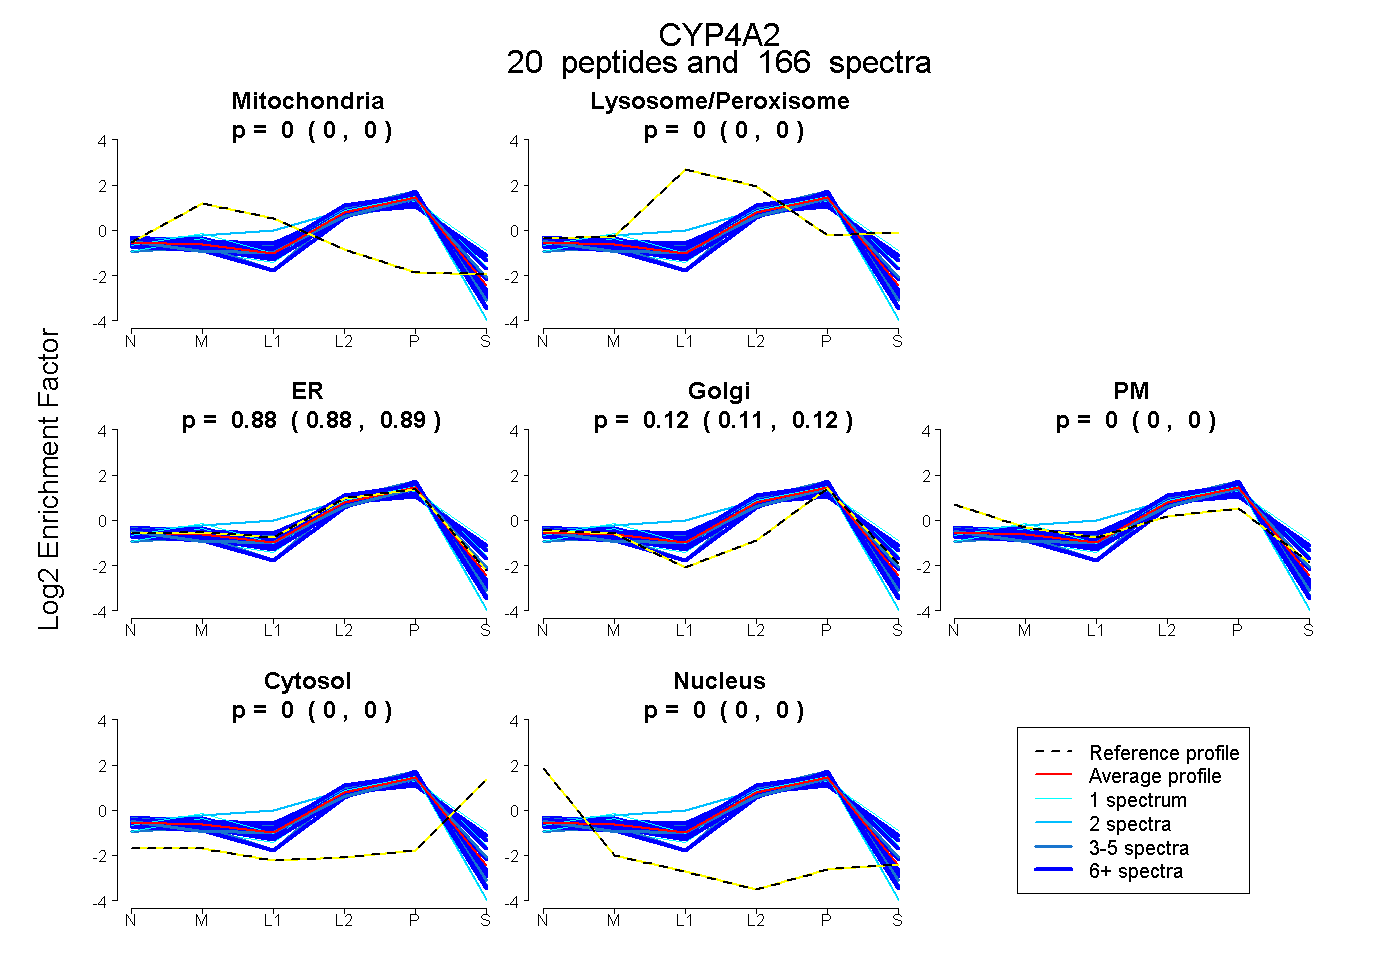 |
0.000 0.000 | 0.000 |
0.000 0.000 | 0.000 |
0.884 0.880 | 0.888 |
0.116 0.111 | 0.119 |
0.000 0.000 | 0.000 |
0.000 0.000 | 0.000 |
0.000 0.000 | 0.000 |
|||
| Plot | Lyso | Other | |||||||||||
| Expt C |
25 peptides |
519 spectra |
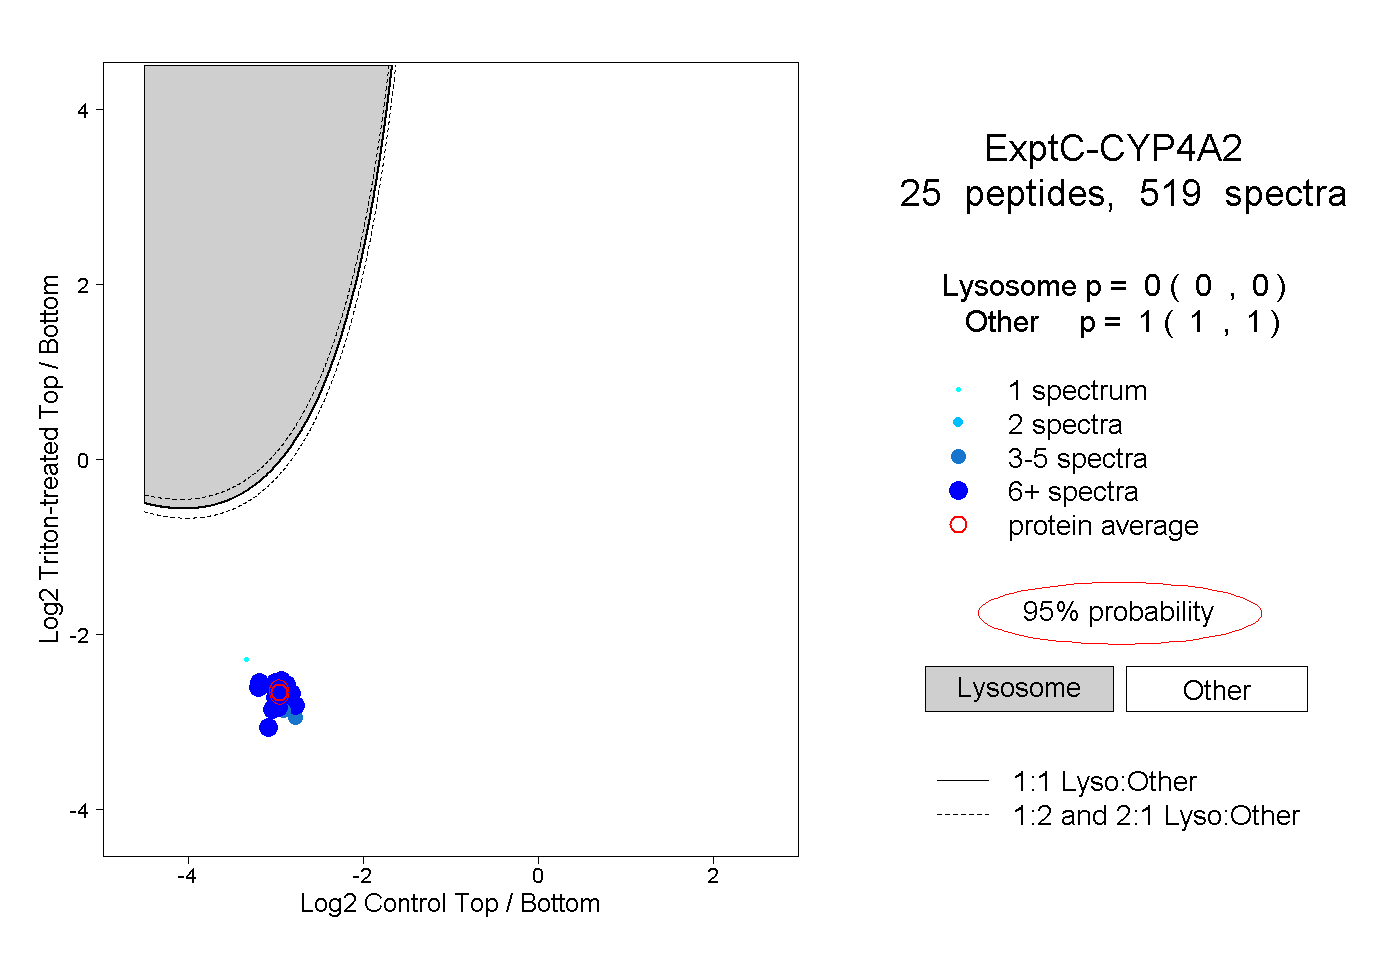 |
0.000 0.000 | 0.000 |
1.000 1.000 | 1.000 |
||||||||
| Plot | Lyso | Other | |||||||||||
| Expt D |
14 peptides |
51 spectra |
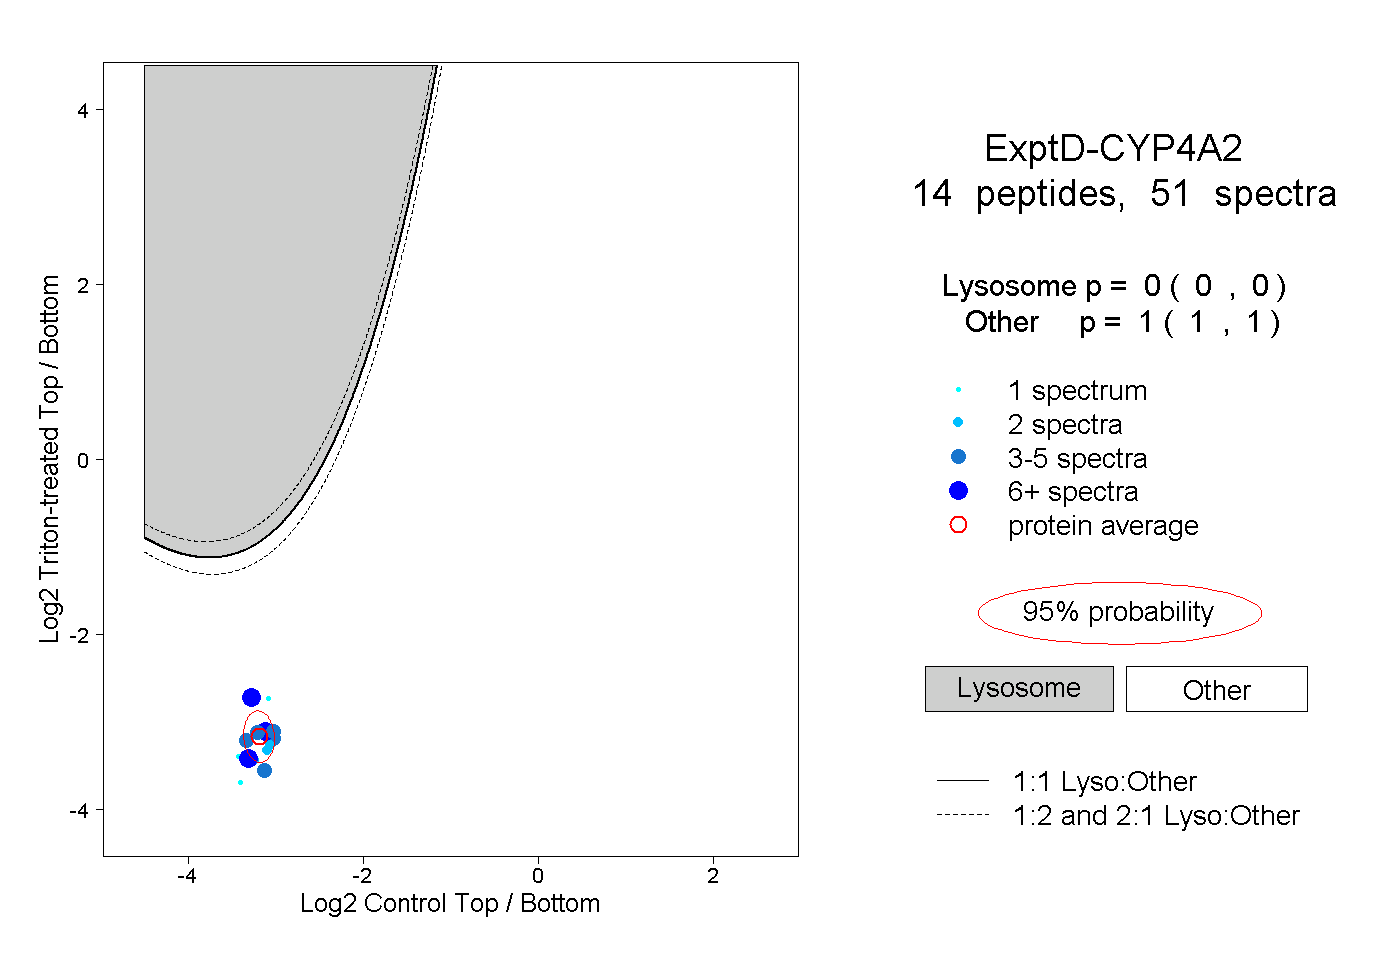 |
0.000 0.000 | 0.000 |
1.000 1.000 | 1.000 |