SLC16A2
[ENSRNOP00000042040]
Main page
| | | Plot |
Mito |
Lyso |
|
Perox |
ER |
Golgi |
PM |
Cytosol |
Nucleus |
|
| Expt A |
 1
1
peptide |
11
spectra |
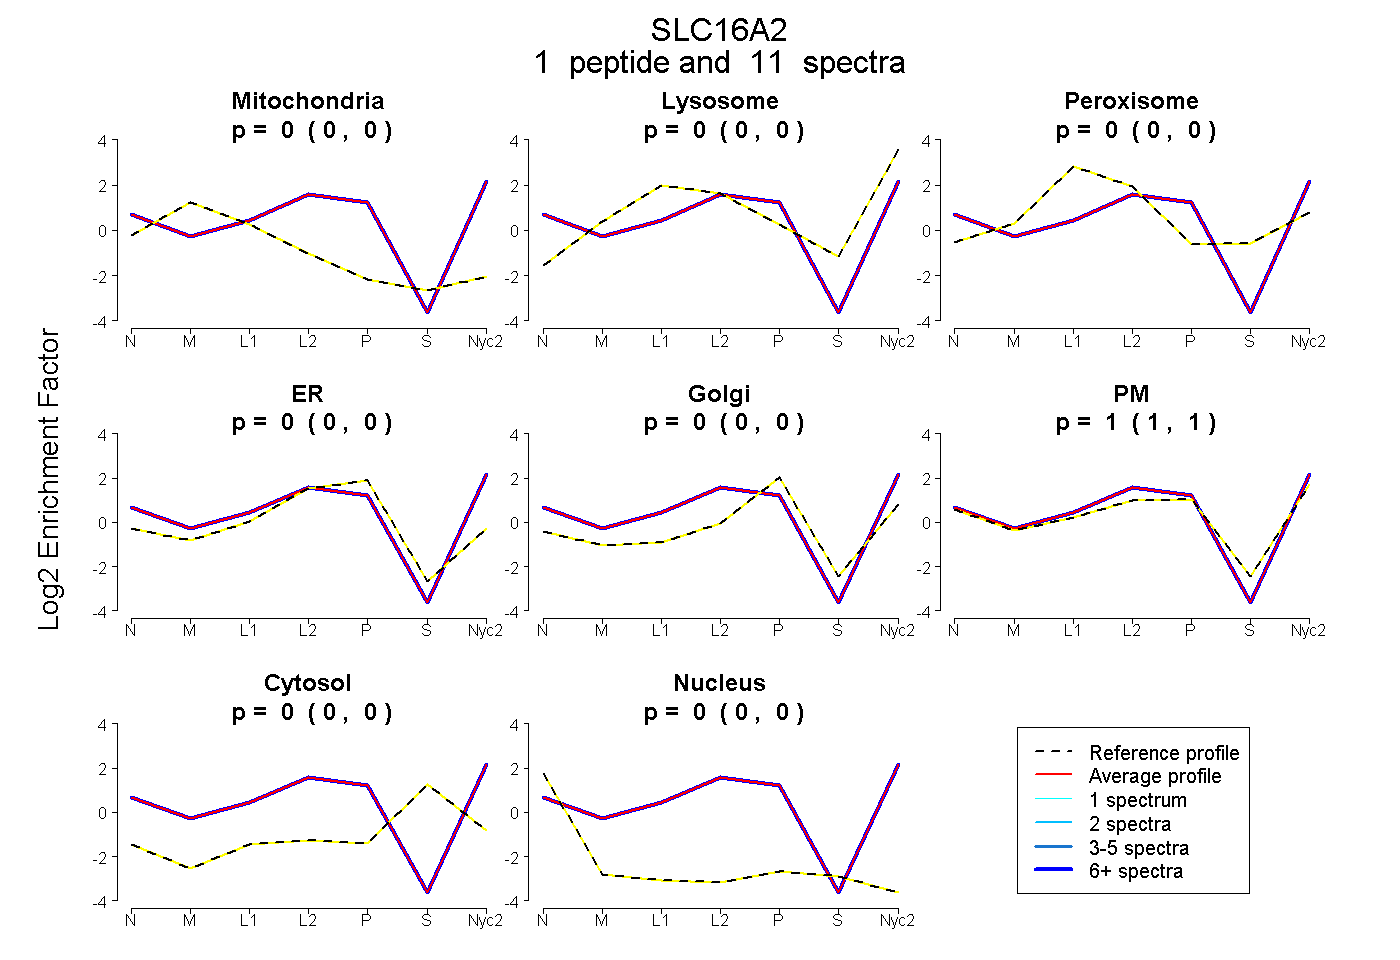 |
0.000
0.000 | 0.000 |
0.000
0.000 | 0.000 |
|
0.000
0.000 | 0.000 |
0.000
0.000 | 0.000 |
0.000
0.000 | 0.000 |
1.000
1.000 | 1.000 |
0.000
0.000 | 0.000 |
0.000
0.000 | 0.000 |
|
| | | Plot |
Mito |
|
Lyso or Perox |
|
ER |
Golgi |
PM |
Cytosol |
Nucleus |
|
| Expt B |
1
peptide |
5
spectra |
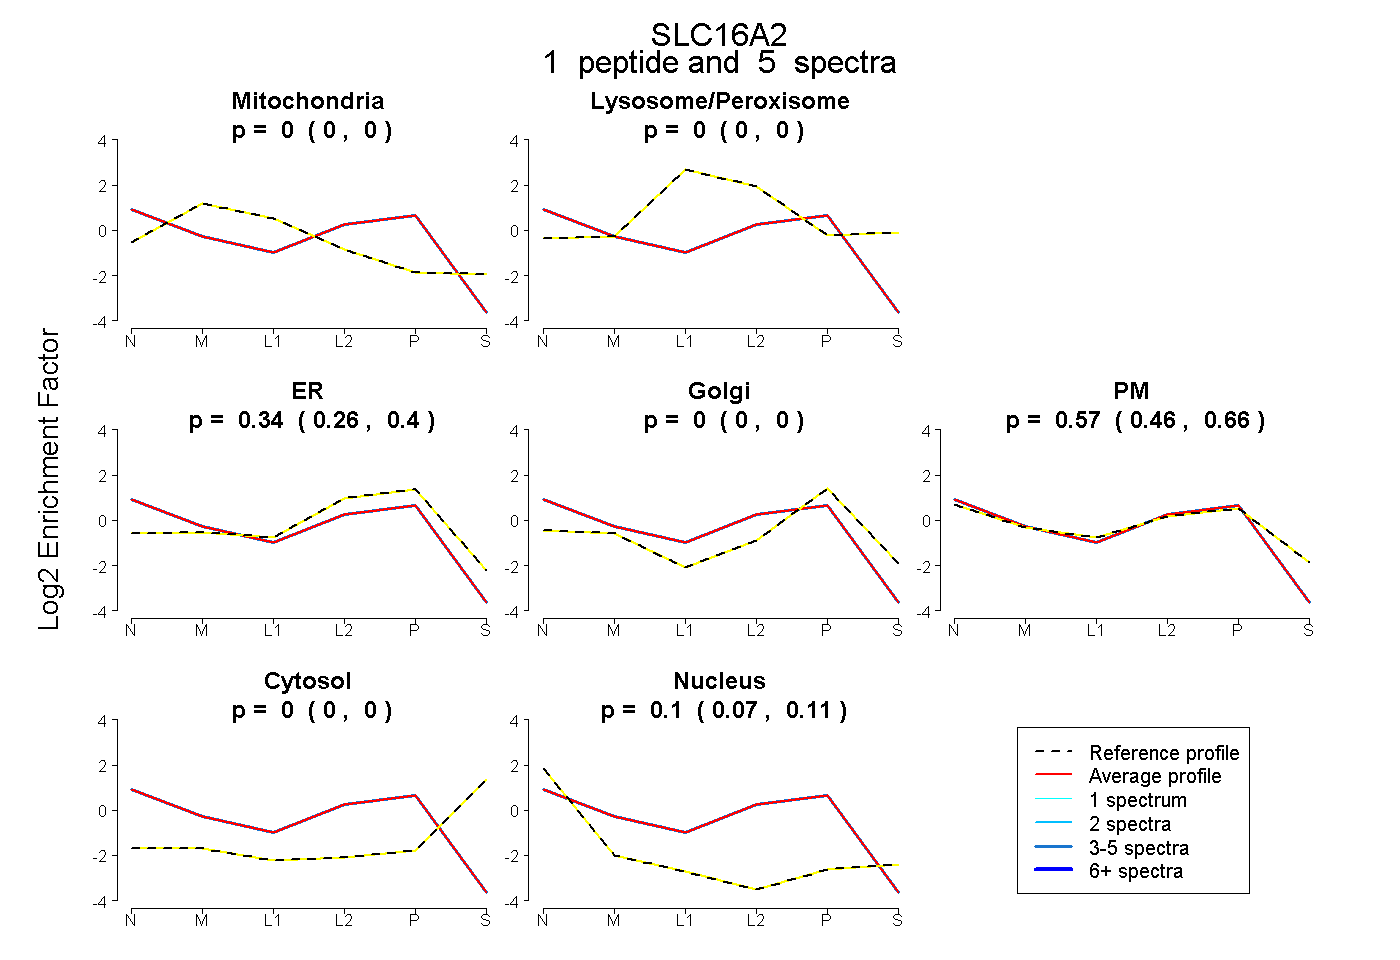 |
0.000
0.000 | 0.000 |
|
0.000
0.000 | 0.000 |
|
0.337
0.255 | 0.401 |
0.000
0.000 | 0.000 |
0.567
0.465 | 0.660 |
0.000
0.000 | 0.000 |
0.096
0.072 | 0.115 |
|
| 5 spectra, FLVQFR |
0.000 |
|
0.000 |
|
0.337 |
0.000 |
0.567 |
0.000 |
0.096 |
|
| | | Plot |
|
Lyso |
|
|
|
|
|
|
|
Other |
| Expt C |
2
peptides |
15
spectra |
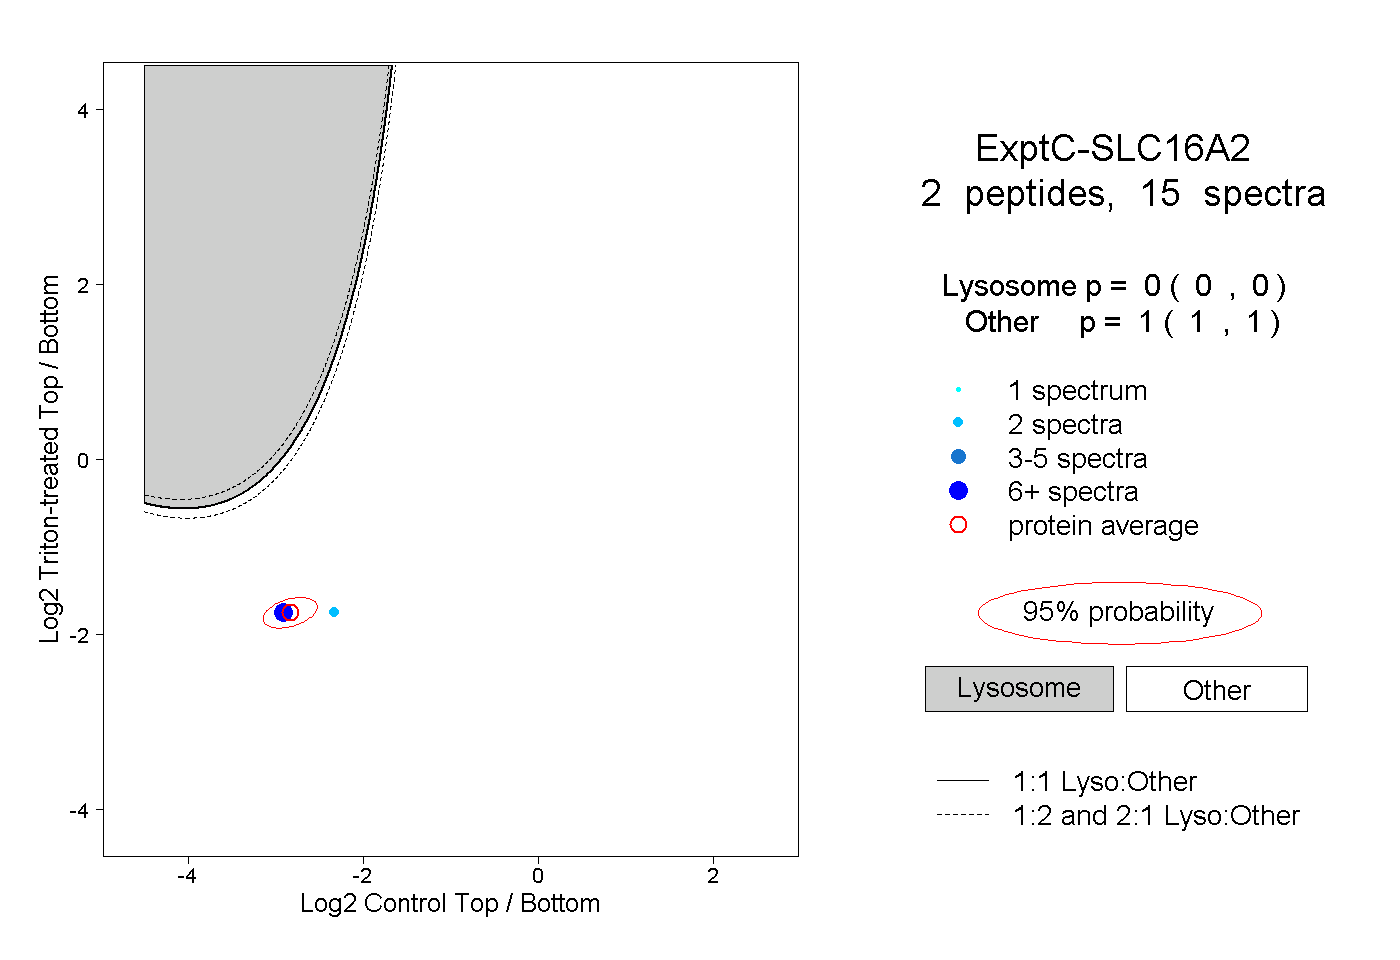 |
|
0.000
0.000 | 0.000 |
|
|
|
|
|
|
|
1.000
1.000 | 1.000 |