 27
27peptides
spectra
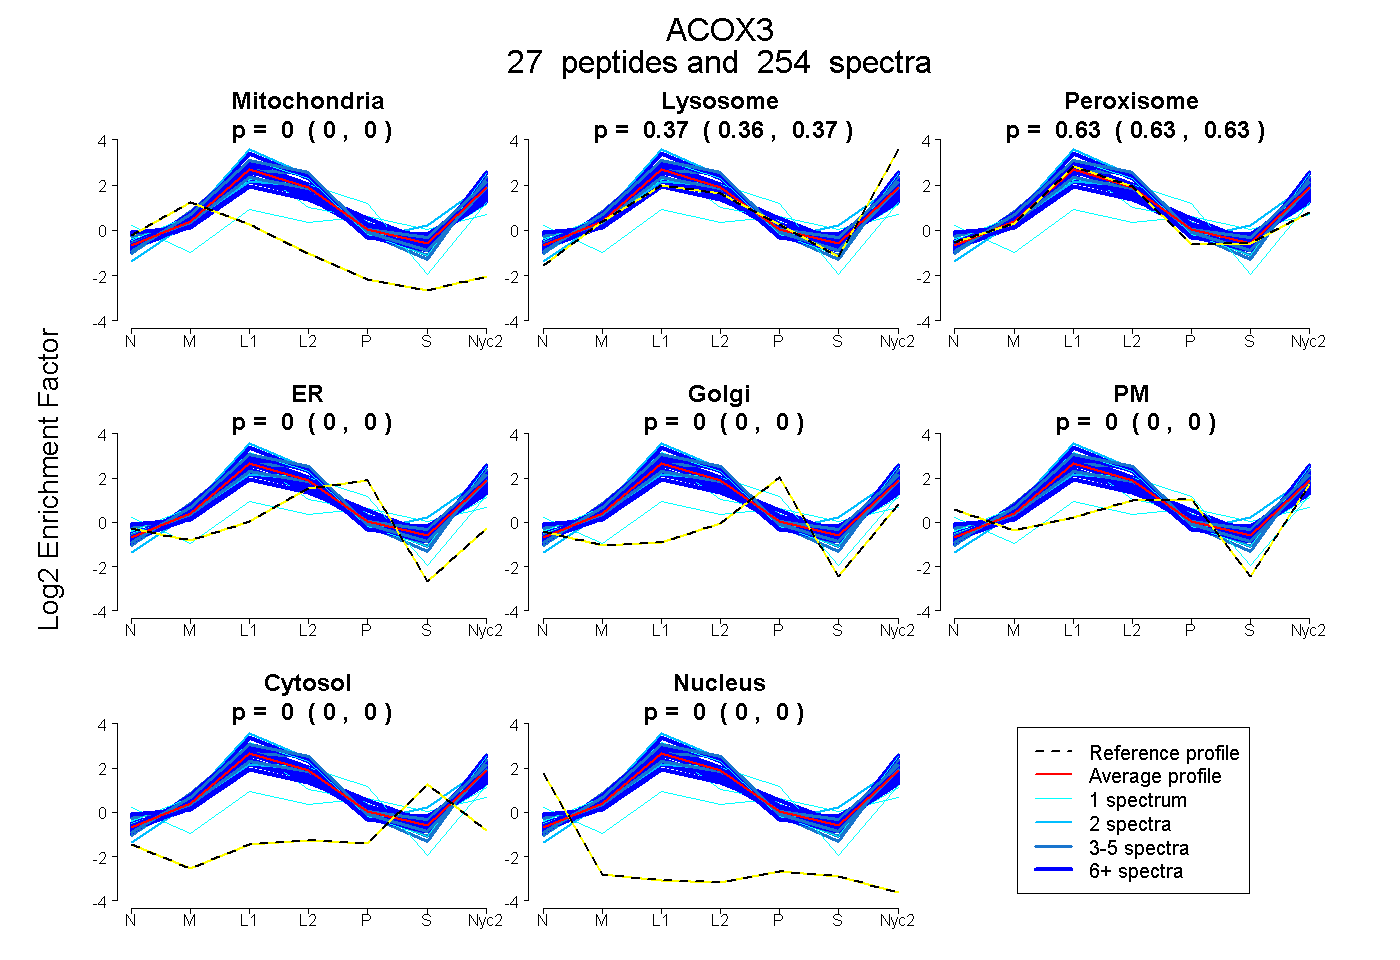
0.000 | 0.000
0.365 | 0.370
0.629 | 0.635
0.000 | 0.000
0.000 | 0.000
0.000 | 0.000
0.000 | 0.000
0.000 | 0.000
29peptides
spectra
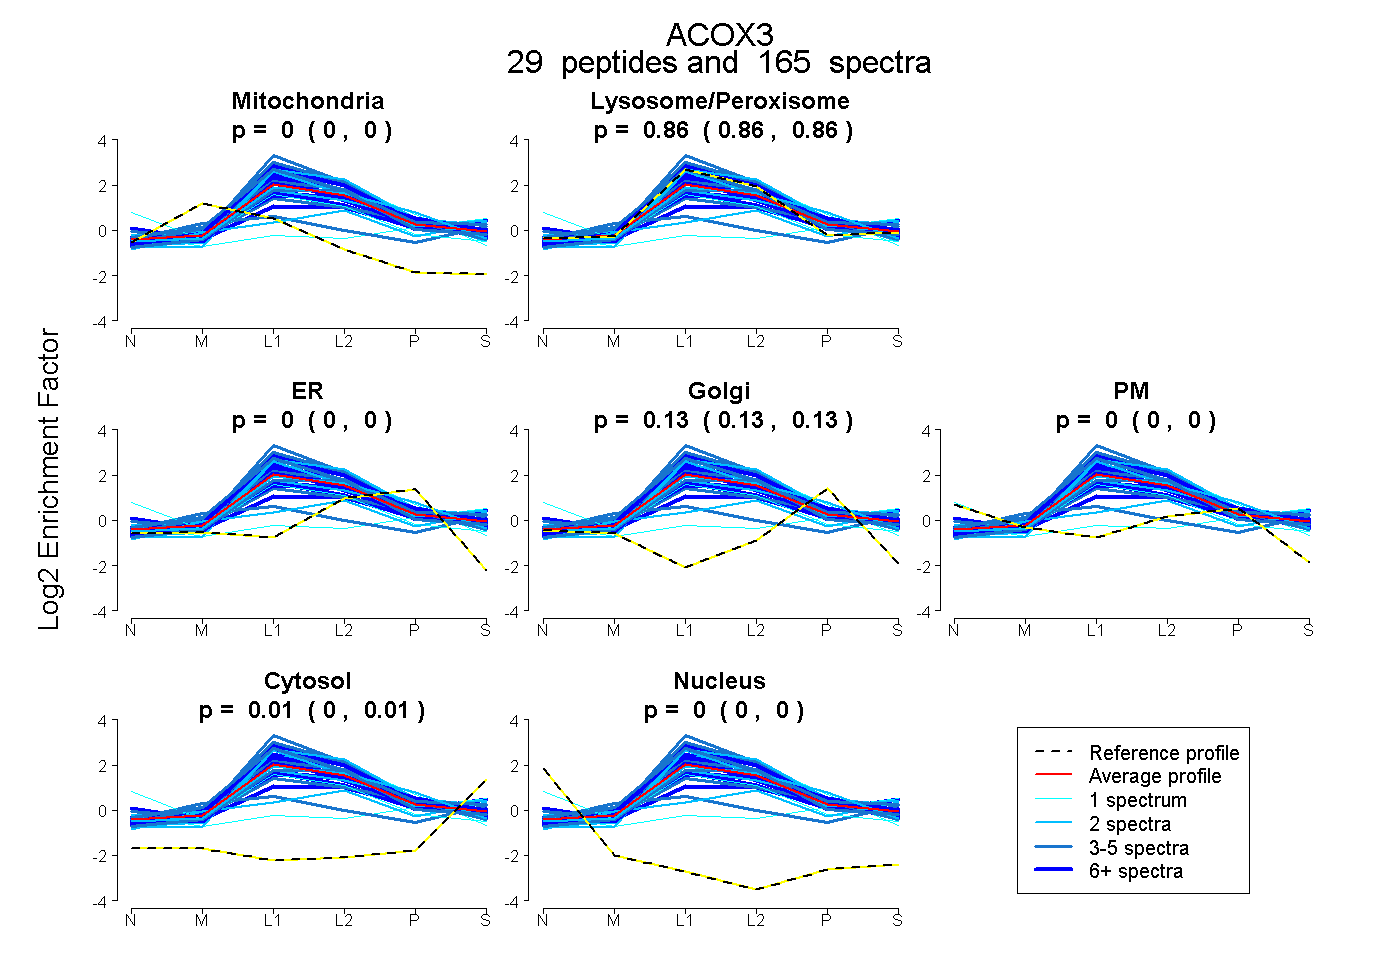
0.000 | 0.000
0.859 | 0.865
0.000 | 0.000
0.129 | 0.134
0.000 | 0.000
0.004 | 0.007
0.000 | 0.000
36peptides
spectra
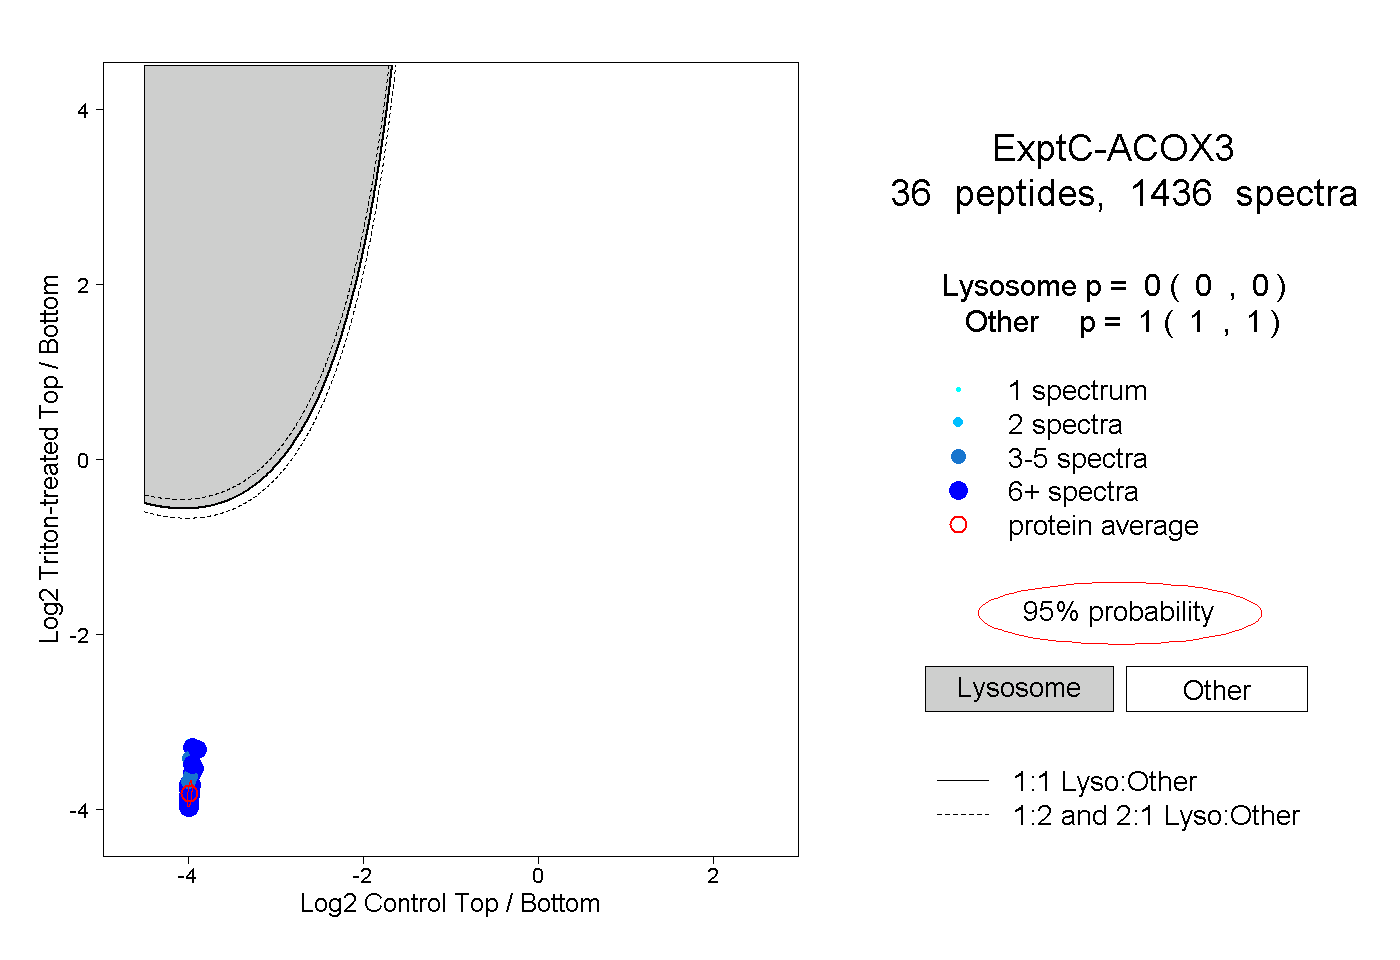
0.000 | 0.000
1.000 | 1.000
24peptides
spectra
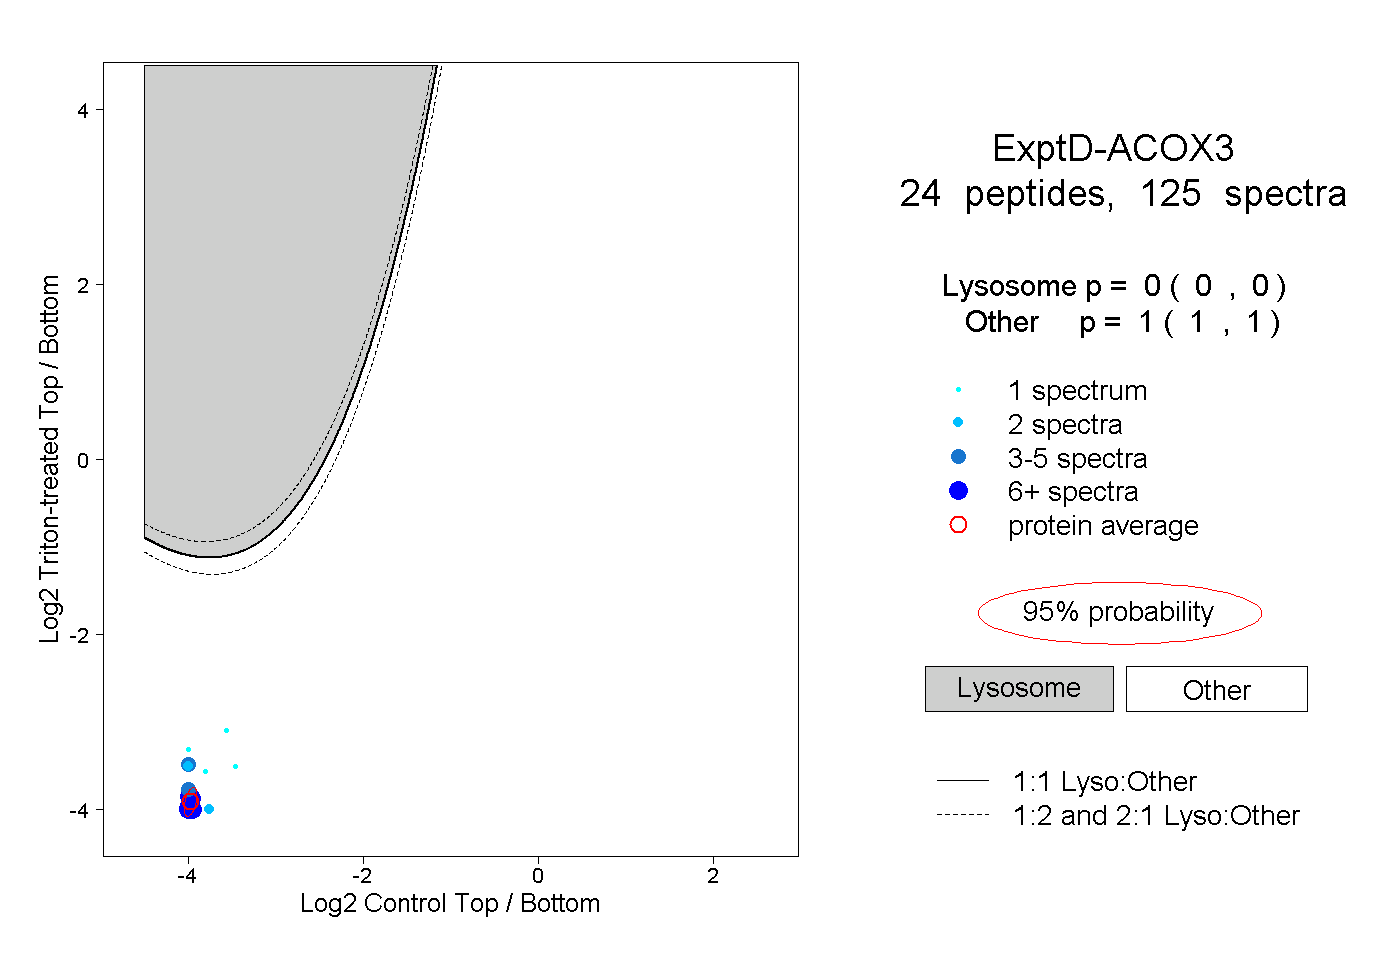
0.000 | 0.000
1.000 | 1.000