 9
9peptides
spectra
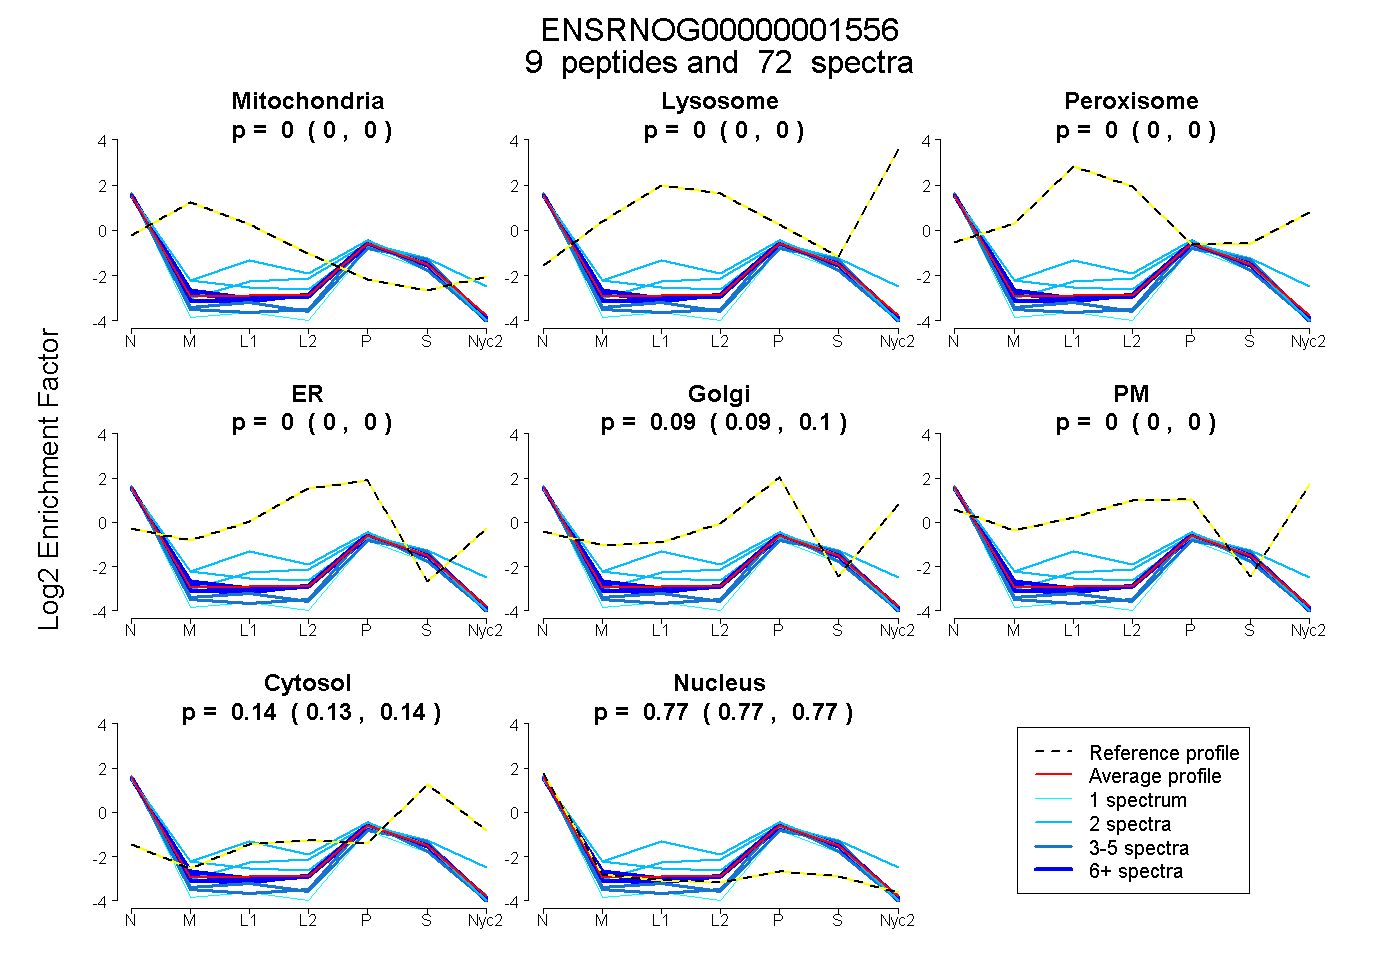
0.000 | 0.000
0.000 | 0.000
0.000 | 0.000
0.000 | 0.002
0.088 | 0.096
0.000 | 0.000
0.133 | 0.138
0.767 | 0.774
2peptides
spectra
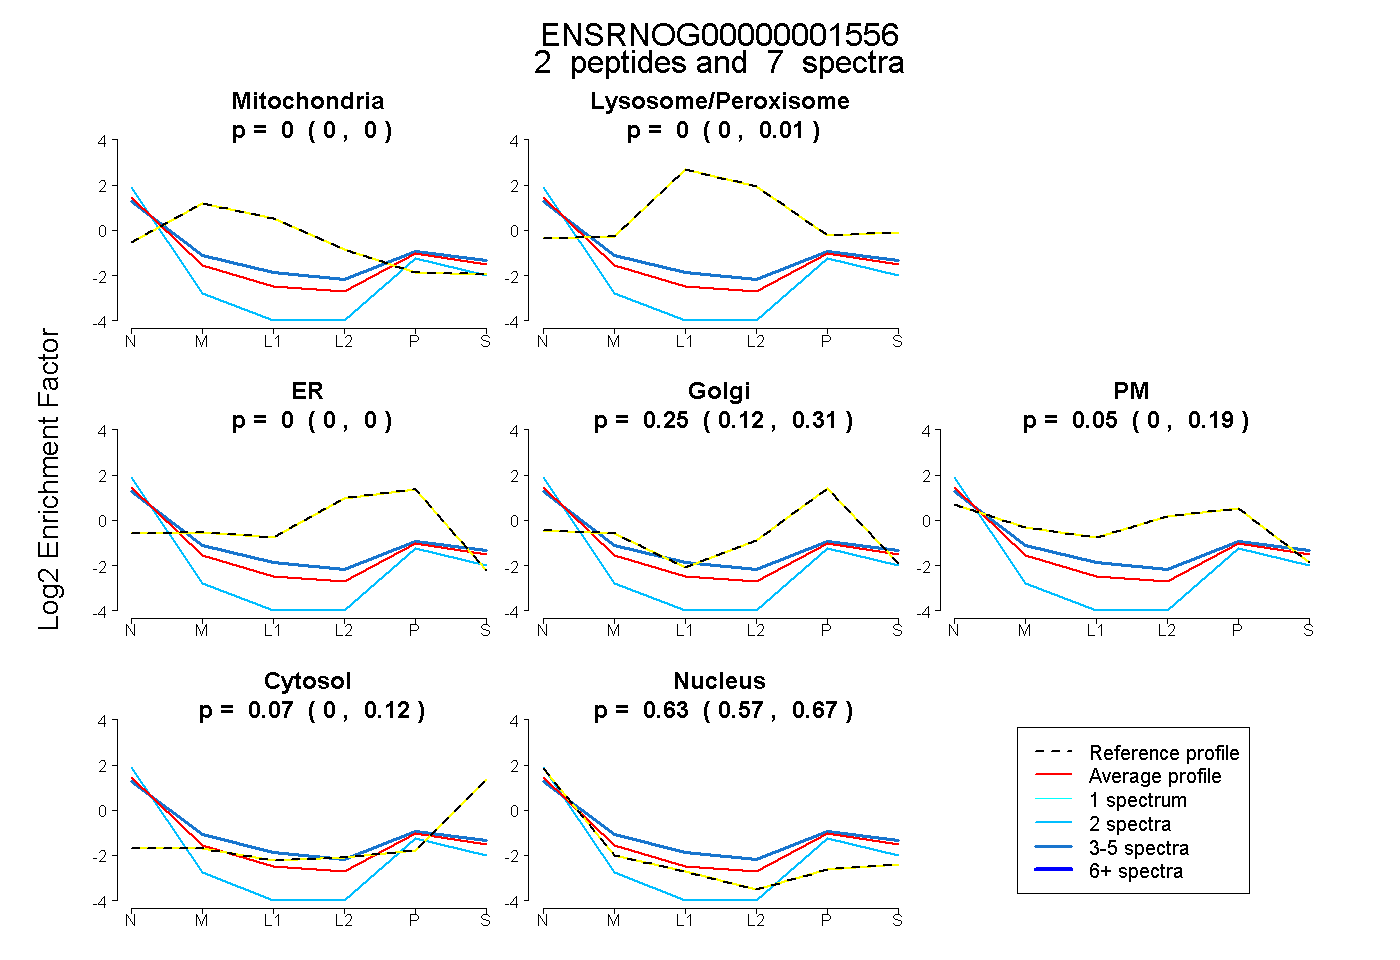
0.000 | 0.000
0.000 | 0.007
0.000 | 0.000
0.116 | 0.315
0.000 | 0.188
0.003 | 0.117
0.567 | 0.675